How do I calculate the standard deviation from a given table?

In summary, to calculate the standard deviation of a set of numbers, you take the first number in the list, subtract the mean, square that number, and multiply that number by the number of times that number appears in the data.
  • #1
ineedhelpnow
651
0
hi (Wave)
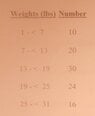
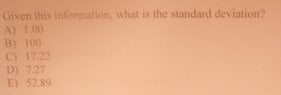
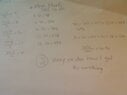
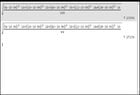
know its a big jump from calc 3 down to stats but i can't remember how to get the standard deviation. I am given this table and I am asked to find the standard deviation. can i please get a step by step solution? thanks (Blush)
View attachment 3232View attachment 3233
 

Attachments

  • DSC00023.JPG
    DSC00023.JPG
    2.7 KB · Views: 70
  • DSC00025.JPG
    DSC00025.JPG
    4.4 KB · Views: 74
Mathematics news on Phys.org
  • #2
Hi there. You know we don't give full solutions here, rather help you figure out how to do it yourself.

To calculate the standard deviation you will need the sample mean. Can you first calculate that?
 
  • #3
I would first compute the mean:

\(\displaystyle \mu=\frac{\sum(xf)}{N}\)

And then compute the standard deviation:

\(\displaystyle \sigma=\sqrt{\frac{\sum\left[(x-\mu)^2f\right]}{N}}\)
 
  • #4
If this information corresponds to a sample of the population instead of the entire population then we should divide by $n-1$. I'm not sure from the image which one it is, but you have enough to get started. :)
 
  • #5
i calculated the mean to be 16.00. but i still can't do the standard deviation.
 
  • #6
Jameson said:
If this information corresponds to a sample of the population instead of the entire population then we should divide by $n-1$. I'm not sure from the image which one it is, but you have enough to get started. :)

Good point...I blithely assumed the data was for a population, not a sample. :D
 
  • #7
Jameson said:
Hi there. You know we don't give full solutions here, rather help you figure out how to do it yourself.

To calculate the standard deviation you will need the sample mean. Can you first calculate that?

Hey! sorry (Blush) i only asked for a step by step solution because I am trying to help someone do this but i can't really remember myself...even though i took stats last semester.
 
  • #8
I get a larger value for the mean...but it has been considerably longer since I took an introductory stats course. For $x$, I used the mean of the ranges.

edit: google says I did the correct thing. :D
 
  • #9
well the choices given for the average weight (i think is the same as mean) hehe
were 14.42, 16.96, 16.69, 16, 15.49
 
  • #10
Yes, I get one of those choices. What calculation did you use?
 
  • #11
MarkFL said:
Yes, I get one of those choices. What calculation did you use?

I also get something on that list.

As a side note, this notation is terrible and I've never seen it before. $1 -< 7$ seems to mean $1<x \le 7$ but it looks horrid.
 
  • #12
i averaged each of the ranges. and then averaged the averages. by -< he means 1 to less than 7
 
  • #13
ididntdoitO_o said:
i averaged each of the ranges. and then averaged the averages. by -< he means 1 to less than 7

Well then there is a mistake. Mark was asking for you to show us your calculations in detail so we can help you find the error. :)
 
  • #14
ididntdoitO_o said:
i averaged each of the ranges. and then averaged the averages. by -< he means 1 to less than 7

You essentially want to use a weighted average...
 
  • #15
(1+7)/2=4 (i thought i would be 1+6 because it says less than 7 but the person I am helping said their instructor said it would up to 7)
(7+13)/2=10
(13+19)/2=16
(19+25)/2=22
(25+31)/2=28

add that up and you 80 and divide by 5 you get 16
 
  • #16
ididntdoitO_o said:
(1+7)/2=4 (i thought i would be 1+6 because it says less than 7 but the person I am helping said their instructor said it would up to 7)
(7+13)/2=10
(13+19)/2=16
(19+25)/2=22
(25+31)/2=28

add that up and you 80 and divide by 5 you get 16

You need to multiply each $x$ by the given frequency, then sum all of the products, then divide by the sum of the frequencies. For example the first product would be $4\cdot10$.
 
  • #17
but that's 84.8
 
  • #18
ididntdoitO_o said:
but that's 84.8

What is? Take a breath, take your time and post your thoughts in full :) We don't know how you got this number. Take some time and explain please.
 
  • #19
right, sorry. switching back and forth between vectors and standard deviation (Blush)
View attachment 3234
 

Attachments

  • DSC00027.JPG
    DSC00027.JPG
    15.6 KB · Views: 49
  • #20
ididntdoitO_o said:
right, sorry. switching back and forth between vectors and standard deviation (Blush)
View attachment 3234

Good, yes that's correct. Now, can you use this mean in the formula I gave in my first post to compute the standard deviation?
 
  • #21
I agree with your answer and the way you did it. I also got 16.96. :)

Now, to find the standard deviation you take the first value in the list of information, subtract the mean then square that number. Since we don't have exact values, we will have to pick the mean of the range.

For example when looking at the range of 1-7, we will do this:

\(\displaystyle (4-16.96)^2\)

This happens 10 times of course, but we don't need to do it each time. Just once then multiply. Anyway, try doing this for the other ranges and see what you get. Take the mean of the range, 1-7, 7-13, etc. and subtract 16.96 then square.
 
  • #22
man that class feels like forever ago. ok so i take each of the x values and subtract the mean (16.96) from them. i square each of the answers. and then i divide by 5 and take the square root?
 
  • #23
oh i need to multiply each one by its frequency?

and it needs to be divided by 4? n-1. (Headbang) i don't know what I am doing
 
Last edited:
  • #24
ididntdoitO_o said:
oh i need to multiply each one by its frequency?

and it needs to be divided by 4? n-1. (Headbang) i don't know what I am doing

You want to compute each square, multiply by the frequency, and sum these up, then divide by the sum of the frequencies, then take the square root of this. I get an answer that is very close to one to the choices.
 
  • #25
Yep, after you do the subtraction and squaring part for each range, multiply that number by the frequency. I'll do the first one.

$(4-16.96)^2 \cdot 10 = 1679.616$

Now do the same thing with the rest. Then you will add all of these big numbers up and divide by 99, since the frequencies add up to 100. But first thing's first - do these calculations, show us your work and your answer so we can check it.
 
  • #26
ok so i just did it on my calculator (sorry but itll take forever by hand and i need to get back to my studying but i really want to finish helping them with their hw)
View attachment 3235

thats still kinda "not the same" as the one given as a choice
 

Attachments

  • 09-14-2014 Image001.jpg
    09-14-2014 Image001.jpg
    12.3 KB · Views: 47
  • #27
Jameson said:
...divide by 99, since the frequencies add up to 100...

Ah, yes now my number matches the choice given. As an aside, why do we subtract 1?
 
  • #28
oh i got it! i put 100 instead of 99. thank you guys! answer is 7.27

- - - Updated - - -

View attachment 3236
thanks mark. thanks jameson.
 

Attachments

  • 09-14-2014 Image002.jpg
    09-14-2014 Image002.jpg
    19.8 KB · Views: 49
  • #29
MarkFL said:
Ah, yes now my number matches the choice given. As an aside, why do we subtract 1?

It's hard to concisely explain. I confess that while I have read many explanations and heard many professors discuss it, it still isn't fully intuitive for me. It comes down to "degrees of freedom" as it's most commonly referred. My favorite professor explained it thusly: you need at least 2 points to have any variance so you can measure the distance between them, which gives you 1 degree of freedom. For 3 points, you have 2 and this extends to the general rule of n-1, where n is the sample size. Another way to think of it is when you sample something and already know n-1 points, if you know the mean you can find the last point so it's not new information. These are very general, non-rigorous arguments though.

Or you can just take it on faith and stop asking questions. We are statisticians here, not mathematicians. We don't prove things! (kidding, statisticians do in fact prove things all the time)
 
  • #30
Jameson said:
It's hard to concisely explain. I confess that while I have read many explanations and heard many professors discuss it, it still isn't fully intuitive for me. It comes down to "degrees of freedom" as it's most commonly referred. My favorite professor explained it thusly: you need at least 2 points to have any variance so you can measure the distance between them, which gives you 1 degree of freedom. For 3 points, you have 2 and this extends to the general rule of n-1, where n is the sample size. Another way to think of it is when you sample something and already know n-1 points, if you know the mean you can find the last point so it's not new information. These are very general, non-rigorous arguments though.

Or you can just take it on faith and stop asking questions. We are statisticians here, not mathematicians. We don't prove things! (kidding, statisticians do in fact prove things all the time)

Thanks, that makes sense about the degrees of freedom. (Yes)

The only thing that really stuck with me from elementary stats was the normal distribution. :D
 

Related to How do I calculate the standard deviation from a given table?

1. What is the formula for calculating standard deviation from a given table?

The formula for calculating standard deviation from a given table is:
σ = √[∑(x-μ)² / N]
Where σ is the standard deviation, ∑ is the sum of the values, x is each individual value, μ is the mean, and N is the total number of values in the table.

2. How do I find the mean from a given table?

To find the mean from a given table, add up all the values in the table and divide the sum by the total number of values. This will give you the average or mean of the data set.

3. What is the purpose of calculating standard deviation?

The purpose of calculating standard deviation is to measure the amount of variation or dispersion in a data set. It tells us how spread out the data is from the mean. A smaller standard deviation indicates that the data points are close to the mean, while a larger standard deviation indicates that the data points are more spread out.

4. Can I use a calculator to calculate standard deviation?

Yes, you can use a calculator to calculate standard deviation. Most scientific calculators have a function for calculating standard deviation. You can also use online calculators or spreadsheet programs like Microsoft Excel to calculate standard deviation.

5. What does a negative standard deviation mean?

A negative standard deviation is not possible as it is the square root of a sum of squared values. If you get a negative value when calculating standard deviation, it is likely due to an error in calculation or data entry. Double check your calculations and data to ensure accuracy.

Similar threads

Replies
6
Views
1K
Replies
3
Views
2K
Replies
11
Views
6K
  • Calculus and Beyond Homework Help
Replies
3
Views
624
  • Set Theory, Logic, Probability, Statistics
Replies
4
Views
990
  • Classical Physics
Replies
7
Views
606
Replies
24
Views
2K
Replies
4
Views
21K
Back
Top