- #1
HoboBones
- 7
- 1
- Homework Statement
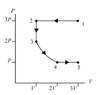
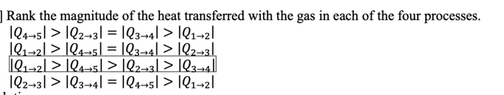
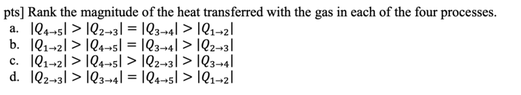
- Rank the magnitude of the heat transferred with the gas in each of the four processes.
- Relevant Equations
- First law of thermodynamics
Thermal energy
Ideal gas law
Work done by gas
Work in isothermal
Apologies, made a mistake when posting. Please see below post.
Last edited: