- #1
Samir_Khalilullah
- 8
- 0
- Homework Statement
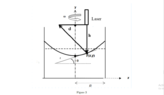
- When a bucket full of water is being rotated, the water surface makes a parabolic shape. If we take a cross section of the surface, its slope will be related to gravitational acceleration, g. That means that we can calculate the values of g by taking the slope measurement at various points.
(see figure in the attachments...)
(A) Suppose the bucket has ω angular velocity. Find the slope of the cross-section when the distance from the center of the bucket is x. Consider the horizontal and vertical components of the forces acting on a small packet of water, a distance "x" from the center of the bucket.
The height of the water surface will remain constant when x = R √2 , where R is the radius of the bucket. This is the condition of maintaining a constant column. This provides us with a stable point to measure slope.
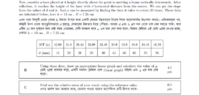
Now, consider a laser placed at h height directly above the point is emitting a beam vertically downwards. After reflection, it reaches the height of the laser with d horizontal distance from the source. We can get the slope from the values of d and h. And ω can be measured by finding the time it takes to rotate 20 times. These data are tabulated below, here h = 13 cm , R = 7.25 cm.
__________________________________________________________________________________________
| 20T (s) | 42.68 | 31.6 | 28.44 | 23.98 | 23.48 | 20.9 | 19.8 | 18.8 | 18.16 | 16.78 |
__________________________________________________________________________________________
| d (mm) | 11 | 20 | 26 | 30 | 40 | 51 | 56 | 65 | 70 | 85 |
__________________________________________________________________________________________
(B) Using these data, draw an appropriate linear graph and calculate the value of g.
(C) Find out the relative error of your result using the reference value.
- Relevant Equations
- none
I did (A) by balancing force on point p (in the figure). I found slope , tanθ = (w^2)x/g. I dont know what to do next. Pls help
 ##\qquad ## !
 ? In that case you will need a relationship between slope ##\theta## and distance ##d##.