- #1
rudransh verma
Gold Member
- 1,067
- 95
- Homework Statement
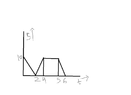
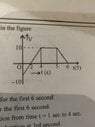
- From the graph evaluate-
1) average velocity for first 6sec
2) average speed for first 6sec
3) average acceleration from1 to 4sec
4)instantaneous a at 3rd sec
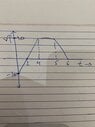
5) plot a-t and x-t graph assuming x=0,t=0
- Relevant Equations
- ##{v_{avg}}=displacement/time##
##average speed= distance/time##
Etc…
3) and 4) is easy. Average and instantaneous acceleration is same from 1 to 4 sec since it’s constant acceleration.
1) and 2) I am unable to get the correct area under the curve.
##s = \frac 12*(-5)*1 + \frac12*10*2 + 10*1 + \frac12*10*1##
Same I guess will be distance.
5) what is the graph of x-t
I have attached the graph below.
1) and 2) I am unable to get the correct area under the curve.
##s = \frac 12*(-5)*1 + \frac12*10*2 + 10*1 + \frac12*10*1##
Same I guess will be distance.
5) what is the graph of x-t
I have attached the graph below.
Attachments
Last edited:
 But
But