- #1
nycmathguy
- Homework Statement
- Use the graph of f(x) to investigate limit.
- Relevant Equations
- Piecewise Function
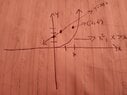
Use a graph to investigate limit of f(x) as
x→c at the number c.
Note: c is given to be 2. This number comes from the side conditions of the piecewise function.
See attachments.
lim (x + 2) as x tends to c from the left is 2.
lim x^2 as x tends to c from the right is 4.
LHL does not equal RHL.
Thus, the limit does not exist.
Note: If my graph is wrong, can someone please graph f(x)? I will then try again.
Thanks