Where can I find a PVT table for water for a 3-D webapp?

In summary, the conversation is about creating a webapp that allows users to view a 3-D PVT phase diagram and manipulate a point on the surface. The speaker is looking for data that defines the PVT surface and can be fed into the program, preferably in an excel format. They are unsure where to find this data and are seeking suggestions.
  • #1
person123
328
52
TL;DR Summary
I want to create a 3D plot for the water PVT diagram and I'm looking for the required data I would need to feed into the computer.
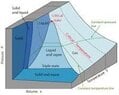
I'm looking to create a little webapp where the user can see the 3-D PVT phase diagram, giving the user functionality like orbiting the surface and moving a point along the surface. (I attached an image of the surface I'm referring to). To do that, though, I would need the data defining the PVT surface to feed into the program.

I don't care how the information is represented as long as it:
  1. Completely defines the surface and the separation between phases
  2. Is in some format I could feed into a computer program (e.g. an excel file would be fine)

Right now, I'm not even sure which direction to take to find this, so any point toward where to look or who I could reach out to would be greatly appreciated!
 

Attachments

  • pvt diagram.jpg
    pvt diagram.jpg
    6 KB · Views: 86
Chemistry news on Phys.org
  • #3
  • Like
Likes Tom.G

1. What is a "Dataset for Water PVT Diagram"?

A "Dataset for Water PVT Diagram" is a collection of data points that represent the physical properties of water at different combinations of pressure, volume, and temperature. This dataset is used to create a graphical representation of the behavior of water under varying conditions, known as a PVT (pressure-volume-temperature) diagram.

2. How is the data in the "Dataset for Water PVT Diagram" collected?

The data in the "Dataset for Water PVT Diagram" is collected through experiments and calculations. Scientists use specialized equipment to measure the physical properties of water at different conditions, and these data points are then compiled to create the dataset.

3. What is the significance of the "Dataset for Water PVT Diagram" in scientific research?

The "Dataset for Water PVT Diagram" is essential in understanding the behavior of water and its phase changes under different conditions. This dataset is used in various fields of science, such as thermodynamics, engineering, and environmental studies, to make predictions and calculations related to water.

4. Can the "Dataset for Water PVT Diagram" be used for other substances besides water?

Yes, similar datasets can be created for other substances, but the specific properties and behavior of each substance will vary. The "Dataset for Water PVT Diagram" is unique to water and cannot be applied to other substances.

5. Is the "Dataset for Water PVT Diagram" available to the public?

Yes, the "Dataset for Water PVT Diagram" is often published in scientific journals or made available online for other researchers to access and use in their studies. However, some datasets may be proprietary and require permission from the creators for use.

Similar threads

Replies
26
Views
3K
Replies
21
Views
5K
  • Introductory Physics Homework Help
Replies
9
Views
144
Replies
26
Views
4K
  • Electrical Engineering
Replies
8
Views
2K
Replies
2
Views
3K
Replies
5
Views
946
  • Astronomy and Astrophysics
Replies
25
Views
1K
Replies
5
Views
1K
Back
Top