- #1
karush
Gold Member
MHB
- 3,269
- 5
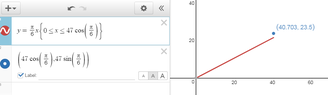
An endpoint on a graph is a point where a line or curve segment ends. It is the farthest point on the graph in a specific direction and can be found at the end of a line, curve, or ray.
To graph an endpoint on Desmos, simply enter the coordinates of the endpoint in the coordinate bar. For example, to plot an endpoint at (3, 5), type (3, 5) in the coordinate bar and press enter. The endpoint will then appear on the graph.
Yes, endpoints can be moved on a Desmos graph by clicking and dragging them to a new location. This can be done for both the x and y coordinates.
To label an endpoint on a Desmos graph, click on the endpoint and select "Add Label" from the options that appear. You can then type in the label you want to appear next to the endpoint.
To customize the appearance of an endpoint on a Desmos graph, click on the endpoint and select "Style" from the options that appear. From there, you can change the color, size, and shape of the endpoint.