Discussion Overview
The discussion revolves around the classification and terminology for describing the shape of a curve generated from a graph. Participants explore various terms and classifications that could accurately represent the curve's characteristics, including its growth and decay behaviors.
Discussion Character
- Exploratory, Technical explanation, Conceptual clarification
Main Points Raised
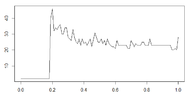
- One participant seeks a high-level classification for the curve, noting exponential growth at approximately x = 0.19.
- Another participant suggests the curve could be described as "semi-sinusoidal about an apparently exponential decay," and also mentions "jagged" as a possible descriptor.
- A different participant describes the curve as resembling a step response followed by exponential decay, estimating a characteristic time of about 0.1 horizontal units and a saturation value of about 23 vertical units, while also noting a noise level with an amplitude of about 2 vertical units.
- Another participant compares the curve to a capacitor output curve following an impulse input voltage.
Areas of Agreement / Disagreement
Participants present multiple competing views on how to classify the curve, with no consensus reached on a single term or classification.
Contextual Notes
Participants express varying interpretations of the curve's shape, with some relying on specific characteristics like exponential decay and noise levels, while others propose more general terms. The discussion does not resolve the definitions or classifications proposed.