Convolution - calculation and drawing

3 replies · 2K views · last reply
aruwin
Messages
204
Reaction score
0
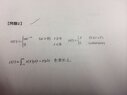
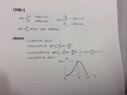
Hi! I need your help with convolution. I am having problem understanding it. I don't understand the example, it shows the calculation and the drawing. Could you please explain the solution to me - why the ranges of t are taken that way and how does the drawing represent the answer?I'll show you one example, and one exercise (the one I need to solve).


Ignore the Japanese writing, it only says to "find z", and "when t=..."
 
Attachments
  • Printed problem 2 in Japanese: x(t) = a e^(-at) for t ≥ 0 (a > 0), 0 for t < 0; y(t) = A for 0 ≤ t < T, 0 otherwise. Asks to find z(t) = integral from -∞ to ∞ of x(τ) y(t−τ) dτ.
    image-14-10-14-02-01-1.jpeg
    28 KB · Views: 150
  • Printed worked example of convolution z(t) of two piecewise functions x(t) and y(t), with cases for t ≤ 0, 0 ≤ t ≤ T, T ≤ t ≤ 2T and t ≥ 2T, plus a sketch of z(t) rising to ABT/2 at t = T and falling to zero at t = 2T.
    image-14-10-14-02-01.jpeg
    32.8 KB · Views: 167
I will try to explain the convolution by analyzing it graphically. (you can see how convolution happen in this link http://upload.wikimedia.org/wikipedia/commons/b/b9/Convolution_of_spiky_function_with_box2.gif)

The convolution is $z(t)= \int \limits_{-\infty}^{\infty} y(\tau)x(t-\tau) \;d\tau$

now take

[math] y(\tau) = \frac{B\tau}{T} \quad 0\leq \tau \leq T[/math]

[math] x(\tau) = A \quad 0\leq \tau\leq T \implies x(t-\tau) = A \quad t-T\leq \tau \leq t[/math]

above two function are shown in the below graph (remember the variable of the integral is $\tau$)View attachment 3428

Now we should see what happens to the integral ($z(t)$) when the value $t$ changes

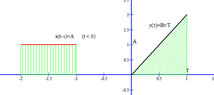
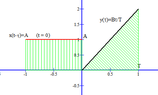
(i) when $t\leq 0$

As the graph below suggest there is no overlapping in the $x(t-\tau)$ and $y(\tau)$
View attachment 3429View attachment 3431

Therefore $\int_{-\infty}^\infty x(t-\tau)y(\tau)$ is 0. Thus when $t\leq 0 \implies z(t)=0$

(ii) When $0<t\leq \tau$
View attachment 3427
View attachment 3433

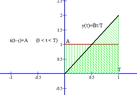
As the graph shows the overlapping of two graphs starts at $\tau=0$ and ends at $\tau=t$.

Therefore the convolution at this scenario will be,

$z(t) = \int_0^t x(t-\tau)y(\tau) d\tau=\int_0^t A\frac{B}{T}\tau d\tau$

Thus, when $$0<t\leq T \implies z(t) = \int_0^t A\frac{B}{T}\tau d\tau$$

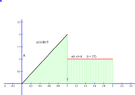
(iii) when $T<t\leq 2T$View attachment 3434

View attachment 3432

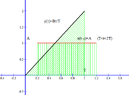
As the graphs show the overlapping always end at $T$ and starts at $t-T$. Therefore the limits of the convolution in this scenario changes as following

$\int\limits_{t-T}^{T} x(t-\tau)y(\tau) \;d\tau = \int\limits_{t-T}^T A\frac{B}{T}\tau d\tau$

$$\therefore \text{when } T<t\leq 2T \implies z(t)=\int\limits_{t-T}^T A\frac{B}{T}\tau d\tau$$

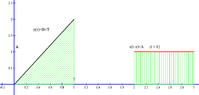
(iv) when $t>2T$

View attachment 3430

On this occasion also the overlapping does not occur (similar to t<0). Therefore the convolution is zero.

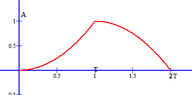
Thus $t>2T \implies z(t) =0$So eventually the piece-wise function of the z will be as following.

$$z(t)=\begin{cases}0 \quad t\leq 0 \\ A\frac{B}{2T}t^2 \quad 0<t\leq T \\ \frac{AB}{2T}(2tT-t^2)\quad T<t\leq 2T\\0 \quad t>2T \\ \end{cases}$$

View attachment 3436

Hope this will help to understand the convolution theory :)
 
Attachments
  • Graph of a rising straight line y(t)=Bt/T from 0 to 2 over t from 0 to 1, with a rectangular pulse x(t-tau)=A for 0<t<T shown as a red and green box, and green hatched overlap region.
    0tT.PNG
    2.8 KB · Views: 157
  • Graph of a rising ramp y(τ)=Bτ/T from 0 to T with its area hatched, and a box x(t-τ)=A spanning 2 to 3 on the τ axis, with axis ticks from -0.2 to 3 and vertical ticks to 2.5.
    normal.PNG
    4.2 KB · Views: 159
  • Graph of x(t-τ)=A for t<0, a rectangular pulse of height A spanning τ from -2 to -1, beside y(τ)=Bτ/T, a rising ramp from 0 at τ=0 to 2 at τ=T=1, shaded under the line.
    t_lest_0.PNG
    2.9 KB · Views: 167
  • Graph of y(τ)=Bτ/T as a rising line from 0 to 2 on [0,1], shaded below, beside a rectangular pulse x(t-τ)=A from about 1.1 to 2.1 at height 1, shaded, with labels A and T on the axes.
    t_lt_2T.PNG
    3.9 KB · Views: 148
  • Graph of two functions against tau: a rectangle x(t-tau)=A spanning tau from -1 to 0 at height A, and a shaded triangle y(tau)=B tau/T rising from 0 to 2 over tau from 0 to 1, with axis ticks at 1, 2, 0.5, -0.5 and -1.
    t0.PNG
    2.6 KB · Views: 150
  • Graph of y(τ)=Bτ/T, a rising line from 0 to 2 over 0 to 1, shaded green, and x(t-τ)=A, a red horizontal segment at height 1 from 1 to 2, marked t = 2T.
    t2T.PNG
    4.1 KB · Views: 168
  • Graph on x-y axes with a red horizontal line at y = 1 labelled A from 0 to 1, and a black diagonal line y(τ)=Bt/T rising from (0,0) to (1,2), with green hatched and grey hatched regions beneath them.
    tT.PNG
    2.7 KB · Views: 167
  • Graph of y(τ)=Bτ/T as a rising line from the origin to (1, 2), and x(t-τ)=A as a horizontal red segment at height 1 from τ=0.2 to 1.2, with the overlap shaded green and T marked on the axis at 1.
    Tt2T.PNG
    3.8 KB · Views: 162
  • Graph of a function A against time, rising as a curve from 0 to a peak of 1 at T, then falling to 0 at 2T, with axis ticks at 0.5, 1, 1.5 and 2T.
    z.PNG
    1.4 KB · Views: 167
Last edited:
BAdhi said:
I will try to explain the convolution by analyzing it graphically. (you can see how convolution happen in this link http://upload.wikimedia.org/wikipedia/commons/b/b9/Convolution_of_spiky_function_with_box2.gif)

The convolution is $z(t)= \int \limits_{-\infty}^{\infty} y(\tau)x(t-\tau) \;d\tau$

now take

[math] y(\tau) = \frac{B\tau}{T} \quad 0\leq \tau \leq T[/math]

[math] x(\tau) = A \quad 0\leq \tau\leq T \implies x(t-\tau) = A \quad t-T\leq \tau \leq t[/math]

above two function are shown in the below graph (remember the variable of the integral is $\tau$)View attachment 3428

Now we should see what happens to the integral ($z(t)$) when the value $t$ changes

(i) when $t\leq 0$

As the graph below suggest there is no overlapping in the $x(t-\tau)$ and $y(\tau)$
View attachment 3429View attachment 3431

Therefore $\int_{-\infty}^\infty x(t-\tau)y(\tau)$ is 0. Thus when $t\leq 0 \implies z(t)=0$

(ii) When $0<t\leq \tau$
View attachment 3427
View attachment 3433

As the graph shows the overlapping of two graphs starts at $\tau=0$ and ends at $\tau=t$.

Therefore the convolution at this scenario will be,

$z(t) = \int_0^t x(t-\tau)y(\tau) d\tau=\int_0^t A\frac{B}{T}\tau d\tau$

Thus, when $$0<t\leq T \implies z(t) = \int_0^t A\frac{B}{T}\tau d\tau$$

(iii) when $T<t\leq 2T$View attachment 3434

View attachment 3432

As the graphs show the overlapping always end at $T$ and starts at $t-T$. Therefore the limits of the convolution in this scenario changes as following

$\int\limits_{t-T}^{T} x(t-\tau)y(\tau) \;d\tau = \int\limits_{t-T}^T A\frac{B}{T}\tau d\tau$

$$\therefore \text{when } T<t\leq 2T \implies z(t)=\int\limits_{t-T}^T A\frac{B}{T}\tau d\tau$$

(iv) when $t>2T$

View attachment 3430

On this occasion also the overlapping does not occur (similar to t<0). Therefore the convolution is zero.

Thus $t>2T \implies z(t) =0$So eventually the piece-wise function of the z will be as following.

$$z(t)=\begin{cases}0 \quad t\leq 0 \\ A\frac{B}{2T}t^2 \quad 0<t\leq T \\ \frac{AB}{2T}(2tT-t^2)\quad T<t\leq 2T\\0 \quad t>2T \\ \end{cases}$$

View attachment 3436

Hope this will help to understand the convolution theory :)
Thank you for the explanation. But I still don't understand how you get the amplitude? How do you know the values of the y axis?
 
BAdhi said:
I will try to explain the convolution by analyzing it graphically. (you can see how convolution happen in this link http://upload.wikimedia.org/wikipedia/commons/b/b9/Convolution_of_spiky_function_with_box2.gif)

The convolution is $z(t)= \int \limits_{-\infty}^{\infty} y(\tau)x(t-\tau) \;d\tau$

now take

[math] y(\tau) = \frac{B\tau}{T} \quad 0\leq \tau \leq T[/math]

[math] x(\tau) = A \quad 0\leq \tau\leq T \implies x(t-\tau) = A \quad t-T\leq \tau \leq t[/math]

above two function are shown in the below graph (remember the variable of the integral is $\tau$)View attachment 3428

Now we should see what happens to the integral ($z(t)$) when the value $t$ changes

(i) when $t\leq 0$

As the graph below suggest there is no overlapping in the $x(t-\tau)$ and $y(\tau)$
View attachment 3429View attachment 3431

Therefore $\int_{-\infty}^\infty x(t-\tau)y(\tau)$ is 0. Thus when $t\leq 0 \implies z(t)=0$

(ii) When $0<t\leq \tau$
View attachment 3427
View attachment 3433

As the graph shows the overlapping of two graphs starts at $\tau=0$ and ends at $\tau=t$.

Therefore the convolution at this scenario will be,

$z(t) = \int_0^t x(t-\tau)y(\tau) d\tau=\int_0^t A\frac{B}{T}\tau d\tau$

Thus, when $$0<t\leq T \implies z(t) = \int_0^t A\frac{B}{T}\tau d\tau$$

(iii) when $T<t\leq 2T$View attachment 3434

View attachment 3432

As the graphs show the overlapping always end at $T$ and starts at $t-T$. Therefore the limits of the convolution in this scenario changes as following

$\int\limits_{t-T}^{T} x(t-\tau)y(\tau) \;d\tau = \int\limits_{t-T}^T A\frac{B}{T}\tau d\tau$

$$\therefore \text{when } T<t\leq 2T \implies z(t)=\int\limits_{t-T}^T A\frac{B}{T}\tau d\tau$$

(iv) when $t>2T$

View attachment 3430

On this occasion also the overlapping does not occur (similar to t<0). Therefore the convolution is zero.

Thus $t>2T \implies z(t) =0$So eventually the piece-wise function of the z will be as following.

$$z(t)=\begin{cases}0 \quad t\leq 0 \\ A\frac{B}{2T}t^2 \quad 0<t\leq T \\ \frac{AB}{2T}(2tT-t^2)\quad T<t\leq 2T\\0 \quad t>2T \\ \end{cases}$$

View attachment 3436

Hope this will help to understand the convolution theory :)
But you got the shapes the other way around. It's x(tau)y(t-tau).
 
Last edited: