lambertlai
- 2
- 0
I try many time to model a simple tensile test for steel MAT_024 but the graph doesn't match from Dyna result and Test result.
Process:
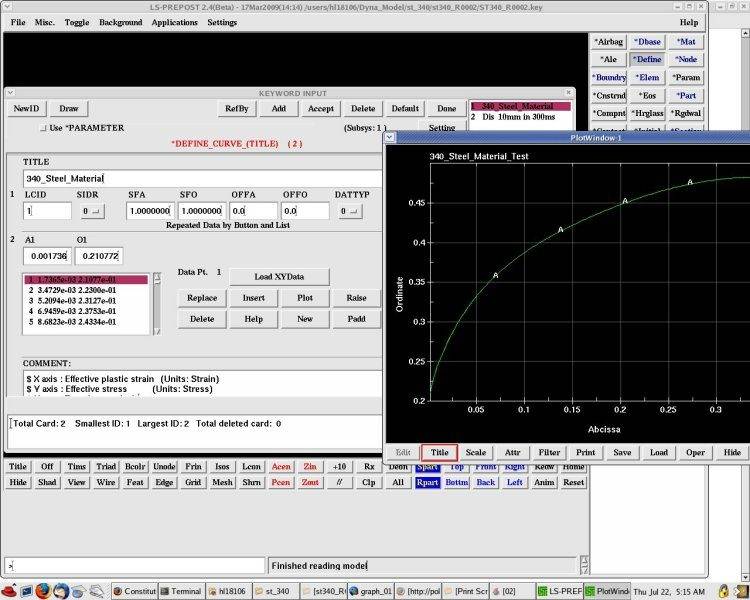
1. Collect data Tensile strain and stress convert to True stress and strain use formula True stress: eng. stress*(1+eng. strain). True strain= ln(1+eng. strain) and then the true strain convert to plastic strain = true strain - (true stress / Young modulus) and plot the graph
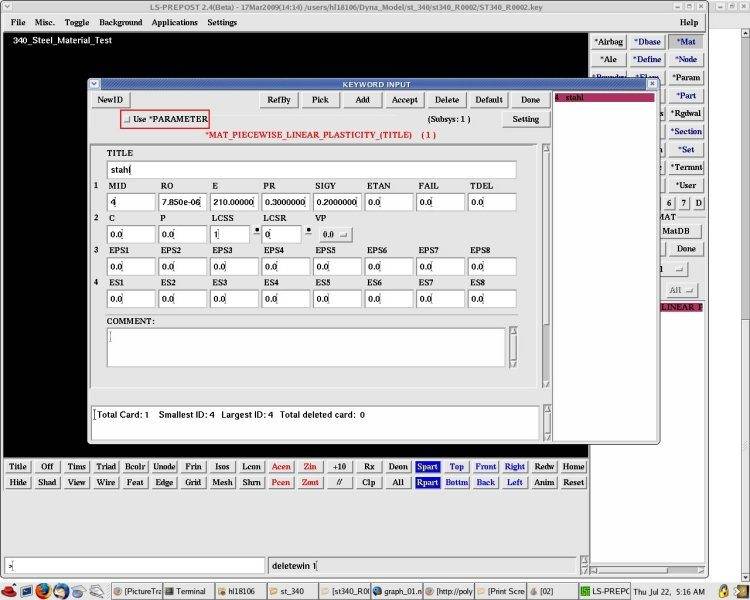
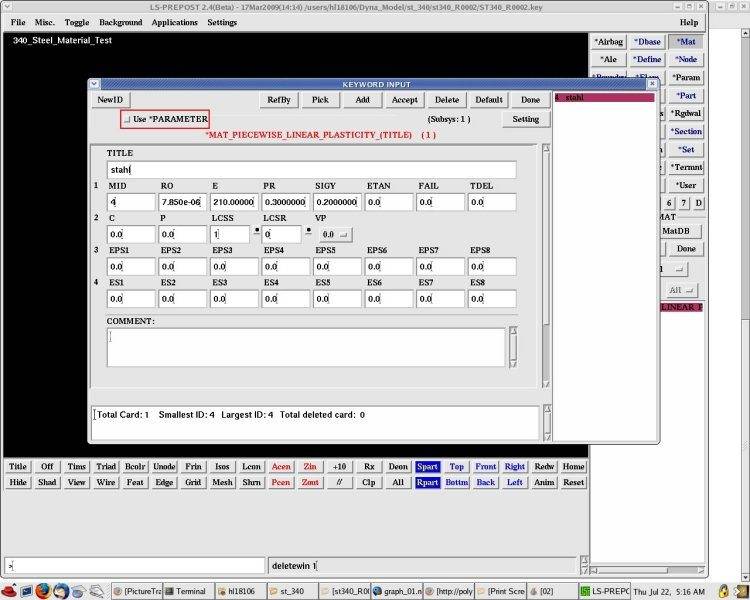
2. Use MAT_024 from dyna
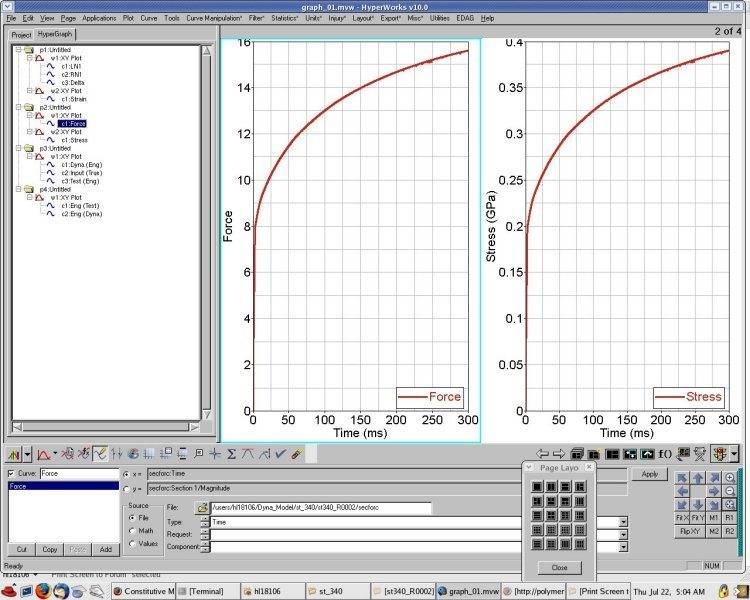
3. Then I extract nodout and sec force.
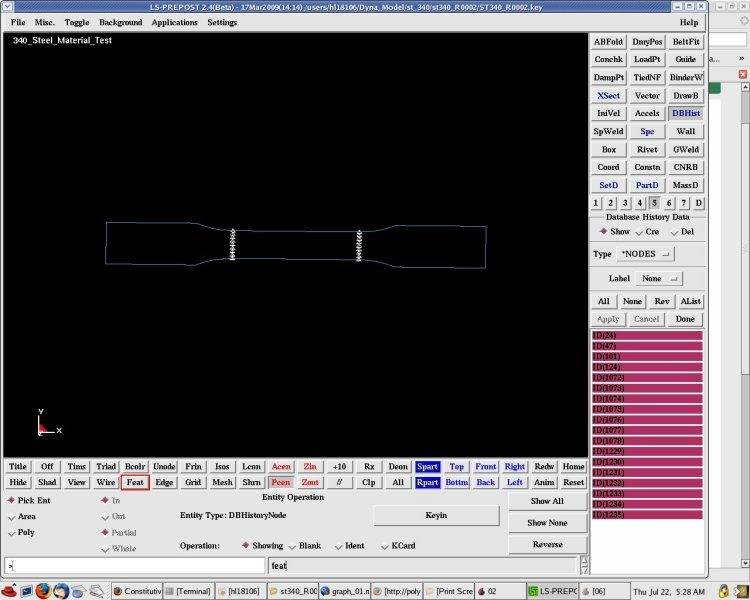
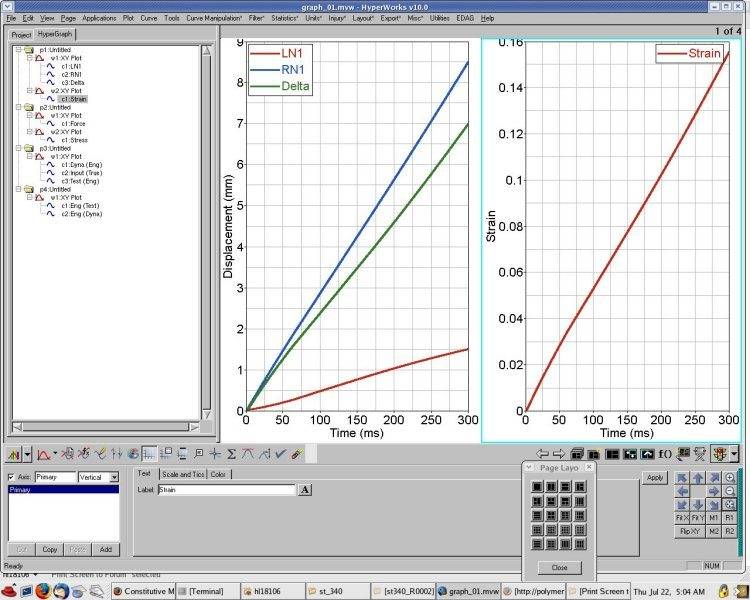
LN1 is left node 1 (triangle on left)
RN1 is right node (triangle on right)
4. Eng stress= Force/Ao and eng. strain= delta Length / original length and plot the graph. (original area is 40, original length is 45mm)
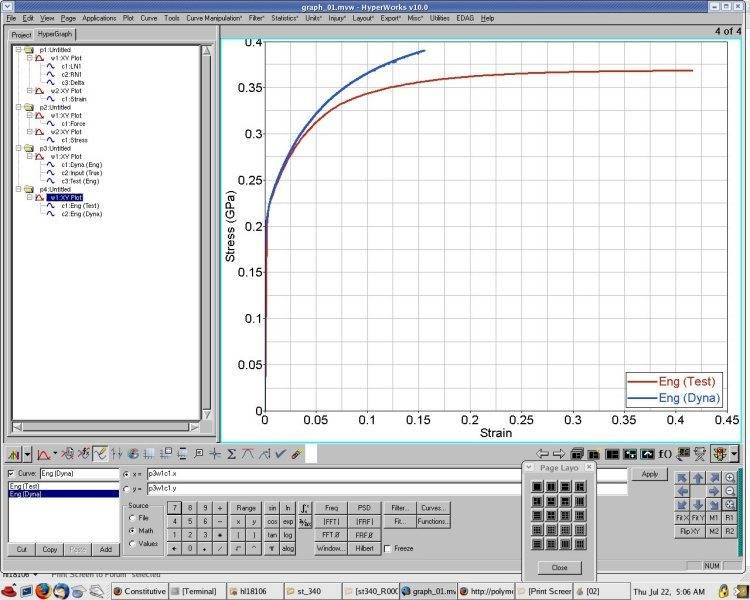
Then the both result was different, why? What the misstake? Anyone can help me solve this problem?
Process:
1. Collect data Tensile strain and stress convert to True stress and strain use formula True stress: eng. stress*(1+eng. strain). True strain= ln(1+eng. strain) and then the true strain convert to plastic strain = true strain - (true stress / Young modulus) and plot the graph
2. Use MAT_024 from dyna
3. Then I extract nodout and sec force.
LN1 is left node 1 (triangle on left)
RN1 is right node (triangle on right)
4. Eng stress= Force/Ao and eng. strain= delta Length / original length and plot the graph. (original area is 40, original length is 45mm)
Then the both result was different, why? What the misstake? Anyone can help me solve this problem?
Last edited: