I Generate a trackmap with speed and g forces

  • I
  • Thread starter Thread starter Gwen49
  • Start date Start date
  • Tags Tags
    G-forces Speed
AI Thread Summary
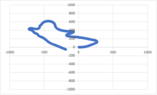
The discussion revolves around generating a track map using speed and G-forces data in Excel. The original poster seeks assistance after referencing a closed thread from 12 years ago. Key issues identified include missing time intervals, incorrect lateral acceleration units, and errors in calculating angles and coordinates. The conversation highlights the importance of understanding the relationship between speed, G-forces, and the car's angle to accurately plot the track. Participants express interest in sharing final versions of their spreadsheets and discuss methods for improving data accuracy and representation.
Gwen49
Messages
5
Reaction score
5
Hello everyone,

I hope you are all great. I am writing down to all of you concerning a problem of mine. I am struggling to generate a trackmap based on Speed (m/s) and G-Forces on excel.
I followed a topic created 12 years ago but unfortunately it is closed :
https://www.physicsforums.com/threads/draw-map-based-on-speed-and-g-forces.518628/

Attached you will find my row data, there is just the beginning of the lap to minimize the file's size, I would be so happy to get some explanations, we never learn enough :-)

Thank you very much!
 

Attachments

Physics news on Phys.org
Welcome to PF.

It's best not to attach files that can contain macros, since those can pose security issues. It's better to post a PDF screenshot of your file, to give others an idea of what you are doing.

Is this for schoolwork, BTW? Or is it for your own personal racing and tuning?
 
Thank you very much!

The file doesn’t contain macro, it’s a xlsx file.
In fact it’s just a file full a data no more, with car speed and g-lat forces.

From that, I would like to draw a track map.

This is for both! Thanks
 
Gwen49 said:
The file doesn’t contain macro, it’s a xlsx file.
Excel files routinely contain macros; I've used them myself to automate various tasks in spreadsheets. There is no way to know if there are macros (good or bad) in an Excel file prior to opening it, AFAIK.

Gwen49 said:
This is for both!
Which both?
 
In your Excel spreadsheet:
  • You are missing the time interval between each measurement;
  • Are you sure the lateral acceleration is in m/s²?
  • dA doesn't include the multiplication with the time interval;
  • Vx & Vy have the wrong angle (they all have 1 rad or 89 rad);
  • X & Y do not include the multiplication with the time interval either;
  • X & Y have the velocity Vx & Vy multiplied by sine and cosine and they shouldn't;
  • Might be better if X0 & Y0 both equal zero;
  • Your graphs are linked to external data.
Because of the large values for R, this looks like a vehicle going in a straight line.
 
jack action said:
In your Excel spreadsheet:
  • You are missing the time interval between each measurement;
  • Are you sure the lateral acceleration is in m/s²?
  • dA doesn't include the multiplication with the time interval;
  • Vx & Vy have the wrong angle (they all have 1 rad or 89 rad);
  • X & Y do not include the multiplication with the time interval either;
  • X & Y have the velocity Vx & Vy multiplied by sine and cosine and they shouldn't;
  • Might be better if X0 & Y0 both equal zero;
  • Your graphs are linked to external data.
Because of the large values for R, this looks like a vehicle going in a straight line.
Jack, massive thanks for this deep analysis, I go back to work!
 
After working today on it, I feel I am not too far away from the right result.
The thing is, I don't know how to figure Ao out. As I don't know Ao and A, I can't solve the equation. I feel like I am stuck.
Is there another way round to know my Ao ? As normally i should be able to draw a trackmap from G forces and Speed I guess there is something I don't get here
Thanks!
 

Attachments

A is the angle of the car with respect to your X-Y plot. It is not the steering angle.
A0 is the initial value.

A1 = A0 + dA0
A2 = A1 + dA1
A3 = A2 + dA2
...

The same concept goes for X and Y.
 
  • #10
Jack,

Big big thanks for your crucial help. I manage to finish the tool I wanted to do.
You are a genius!

See you soon!
 

Attachments

  • pau excel.png
    pau excel.png
    7.1 KB · Views: 113
  • Like
Likes palagi, Juanda and jack action
  • #11
Can you post the final version of your spreadsheet? Also, can there be a correction factor applied to lateral G to join the ends of the plot? I assume these are the same position on the track (start/finish)... I recall about 25 years ago, PI datalogging software would automatically do this to represent a track map.

I also notice that your plot is a mirror image of the actual Pau track. Again can this simply be corrected by multiplying Lateral G by -1?
 
  • #12
Welcome to PF. :smile:

palagi said:
Can you post the final version of your spreadsheet?

@Gwen49 has not been back since June of 2023, so about a year. Hopefully he gets an e-mail notification about your post (or my tagging him) and comes back to respond.
 
  • #13
Thanks, I'm no maths genius,, just a hack programmer that tries to solve such challenges by adapting other smarter peoples stuff. I am building a dash logger with my son for his track bike and would love to be able to plot track maps. GPS data is not fine enough and this method being tied to distance enables overlay comparisons of data from one lap with another with an indicator on a map for reference.
 
  • #14
palagi said:
Thanks, I'm no maths genius,, just a hack programmer that tries to solve such challenges by adapting other smarter peoples stuff. I am building a dash logger with my son for his track bike and would love to be able to plot track maps. GPS data is not fine enough and this method being tied to distance enables overlay comparisons of data from one lap with another with an indicator on a map for reference.
What is your data acq suite on that track bike? I'm sure you have speed, but how do you handle the combined g-forces and bike lean angle?
 
Back
Top