member 731016
- Homework Statement
- Please see below
- Relevant Equations
- Please see below
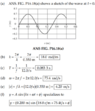
For part(a) of this problem,

The solution is,

I don't understand why they assume on the graph where that the waveform is during it's phase. For example, could it not also be correctly drawn as shown in red:

Could it not?
Many thanks!
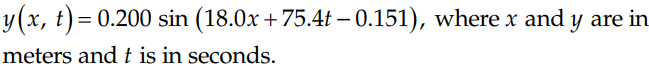
The solution is,
I don't understand why they assume on the graph where that the waveform is during it's phase. For example, could it not also be correctly drawn as shown in red:
Could it not?
Many thanks!