Graphing a piecewise function (Python)

Join the discussion
Ask a follow-up here, or get your own question answered by working scientists, mathematicians and engineers — people, not an autocomplete.
Real named experts · corrections over time · the nuance an AI answer skips
2 replies · 5K views
member 731016
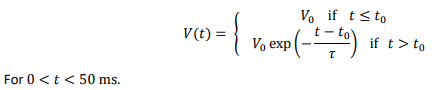
I am trying to write a python script to plot the function,
1683316565374.png

Where
##V_0 = 5~V##
##t_0 = 10~ms##
##\tau = 5~ms##

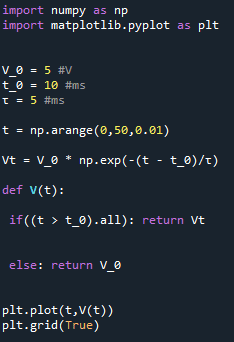
My script that I have written to try to do this is,
1683318107347.png

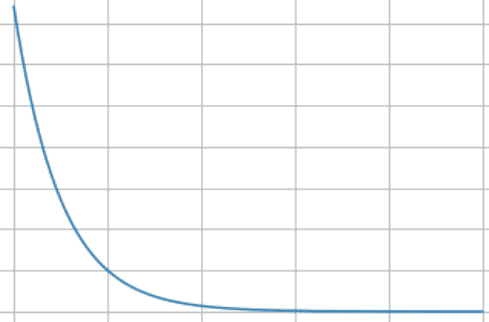
Which plots,
1683318013306.png

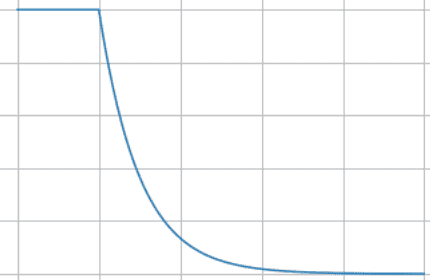
However, the plot is meant to look like this with the horizontal line.
1683317219596.png

Can someone please give me some guidance to get that graph?

Many thanks!
 
Last edited by a moderator:
Physics news on Phys.org
(Please copy your code and paste it between [code] tags; don't just post a screenshot. It is better to call your variable tau rather than use a unicode symbol.)

(t > t_0).all is a method; its boolean value is True. Thus your function will only ever return the unmodified Vt. You need to add () after all to actually call the method. But that isn't what you want either.

(t > t_0).all() is True if every element of t is greater than t_0 and False otherwise. But you need to apply the condition on the level of each element; an if statement won't do that unless included in a loop over the index of the array.

Having calculated Vt, you only need to overwrite those elements where t <= t_0 is True. That can be done easily:
Python:
Vt[t <= t_0] = V_0 

plt.plot(t,Vt)

Alternatively, you can explicitly allocate your points to each range:
Python:
t = np.concatenate(
    [np.linspace(0,t_0, 21), np.linspace(t_0, t_max, 101)],
)

Vt = np.concatenate(
    [V0 * np.ones(21), V0 * np.exp(-np.linspace(0,t_max-t_0,101)/tau)]
)
 
Last edited:
Reply
  • Like
Likes   Reactions: member 731016
pasmith said:
(Please copy your code and paste it between [code] tags; don't just post a screenshot. It is better to call your variable tau rather than use a unicode symbol.)

(t > t_0).all is a method; its boolean value is True. Thus your function will only ever return the unmodified Vt. You need to add () after all to actually call the method. But that isn't what you want either.

(t > t_0).all() is True if every element of t is greater than t_0 and False otherwise. But you need to apply the condition on the level of each element; an if statement won't do that unless included in a loop over the index of the array.

Having calculated Vt, you only need to overwrite those elements where t <= t_0 is True. That can be done easily:
Python:
Vt[t <= t_0] = V_0

plt.plot(t,Vt)

Alternatively, you can explicitly allocate your points to each range:
Python:
t = np.concatenate(
    [np.linspace(0,t_0, 21), np.linspace(t_0, t_max, 101)],
)

Vt = np.concatenate(
    [V0 * np.ones(21), V0 * np.exp(-np.linspace(0,t_max-t_0,101)/tau)]
)
Thank you for your help @pasmith! That is very helpful!