jackiemendez
- 9
- 0
Member warned to use the formatting template for homework posts.
1. I'm given time (s), extension (mm), tensile stress (mPa), and tensile strain (%) in a table. I'm supposed to graph it on excel, but my graphs don't look at all like a stress-strain graph.
2. I think it's probably because I'm using tensile stress or strain? Or is it an excel error I'm doing? If anyone can help me it'll be much appreciated!
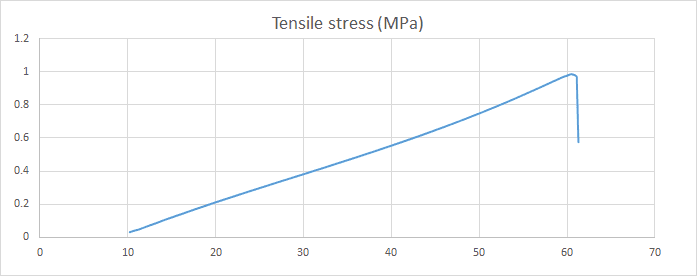
Can someone please help out please?
2. I think it's probably because I'm using tensile stress or strain? Or is it an excel error I'm doing? If anyone can help me it'll be much appreciated!
Can someone please help out please?
Attachments
