Kakashi
- 30
- 1
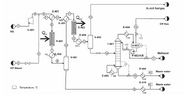
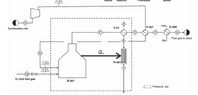
I have attached the process flow diagram for methanol synthesis by steam reforming of natural gas. In this process, low-pressure steam is used in the reboiler, while high-pressure steam is used to preheat the syngas feed to the methanol reactor (130–250°C).
I have already optimized the process by adjusting operating variables such as the steam-to-methane ratio, system pressure, and distillation column pressure while considering constraints like reactor volume and temperature. Now, I am conducting a pinch analysis to further reduce utility usage and operating costs.
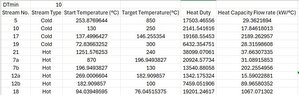
(7a and 7b) and (12a and 12b) are streams that undergo a phase change. I have broken Stream 7 into two dummy streams, one representing the stream as it is cooled to its dew point and the other representing the stream as it is further cooled to its desired temperature. Same goes to stream 12. Streams 17 and 18 (17 and 18 are not labelled in the PFD ) represent the streams that pass through the column reboiler and condenser. I didnt break down those streams because their temperature change while they phase change is minimal
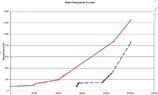
I adjusted the temperatures of the hot and cold streams, rank each temperature in descending order and calculated the enthalpy of each temperature interval. An enthalpy cascade was designed. In the initial pass, no heat was added from outside. The residual enthalpy was always positive indicating no process pinch. However, looking at the composite curve there is a psuedo-pinch temperature at 142.4996427 C. The design for the heat exchanger network should start from the psuedo-pinch and move away from it.
I understand that after identifying the pinch or pseudo-pinch, stream matching must follow two key criteria:
Why is splitting necessary when the available heat in the hot streams is sufficient to satisfy the demand of the cold streams while still meeting the minimum temperature difference requirement?
Also, since there are practical limitations to consider when matching hot and cold streams, I could take advantage of the high temperature and heat in the hot streams to produce a heating medium that meets the cold streams' demands. For example, instead of matching Stream 7 to reboil the stream in the column, we could produce low-pressure steam instead.
I have already optimized the process by adjusting operating variables such as the steam-to-methane ratio, system pressure, and distillation column pressure while considering constraints like reactor volume and temperature. Now, I am conducting a pinch analysis to further reduce utility usage and operating costs.
(7a and 7b) and (12a and 12b) are streams that undergo a phase change. I have broken Stream 7 into two dummy streams, one representing the stream as it is cooled to its dew point and the other representing the stream as it is further cooled to its desired temperature. Same goes to stream 12. Streams 17 and 18 (17 and 18 are not labelled in the PFD ) represent the streams that pass through the column reboiler and condenser. I didnt break down those streams because their temperature change while they phase change is minimal
I adjusted the temperatures of the hot and cold streams, rank each temperature in descending order and calculated the enthalpy of each temperature interval. An enthalpy cascade was designed. In the initial pass, no heat was added from outside. The residual enthalpy was always positive indicating no process pinch. However, looking at the composite curve there is a psuedo-pinch temperature at 142.4996427 C. The design for the heat exchanger network should start from the psuedo-pinch and move away from it.
I understand that after identifying the pinch or pseudo-pinch, stream matching must follow two key criteria:
- The number of hot streams must be less than or equal to the number of cold streams.
- The heat capacity flow rate of the hot stream (CPH) should be less than or equal to that of the cold stream (CPC) to ensure proper pairing.
Why is splitting necessary when the available heat in the hot streams is sufficient to satisfy the demand of the cold streams while still meeting the minimum temperature difference requirement?
Also, since there are practical limitations to consider when matching hot and cold streams, I could take advantage of the high temperature and heat in the hot streams to produce a heating medium that meets the cold streams' demands. For example, instead of matching Stream 7 to reboil the stream in the column, we could produce low-pressure steam instead.