I don't play guitar, or any musical instrument for that matter, My background is mainly in electronics (with bits from other technical fields). I'll likely get a few details 'not quite right' but most of it should be close.
That said, lets try this.
"Why doesn't it distort?"
A)
As I understand a guitar pickup, it is a coil of wire wound around a permanent magnet. A wire will have a voltage induced in it if it is in a changing magnetic field. A coil of wire will have that voltage induced into each turn; with the induced voltages from each turn adding to each other.
Even though it isn't a magnet, the string of an electric guitar is made of a material that is magnetic; that means it
can be magnetized and will also be attracted to a magnet.
When that guitar string is near a magnet it distorts the magnetic field around the magnet. If the string is vibrating, the magnetic field around the magnet will change with the vibration. For a given motion the
amount the field changes depends on how close the string is to the magnet.
B)
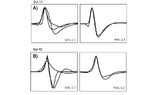
That coil of wire around the magnet will have a voltage induced in it by the changing magnetic field. The amount of voltage will depend an the field strength, how close the string is to the magnet/coil, and how fast the string is vibrating (what note it is playing). WIth this setup, the only way to get distortion is if the string contacts the pickup. If the string hits the pickup, it is not moving for an instant, no changing field, no output voltage (in other words, the output waveform would have a notch in it.)
C)
This is where I make the assumptions that:
1) the 'nominal' output voltage from the pickup coil would be measured at a 'standard' distance between the pickup and string,
2) while playing a specific note,
3) and that the string is made with a 'standard' material.
D)
Given the above assumptions, the pickup could be designed to give a specific output voltage at 'standard' conditions; perhaps 0.7V.
Now none of the above says anything about the maximum input voltage the
amplifier can handle without distortion. Since amplifiers do have volume controls, their gain can readily be adjusted to handle a wide range of input voltages without distortion. If you
want distortion, use a Fuzz Box.
Hope this helps!
Cheers,
Tom
ADDENDUM: That "coil in a changing magnetic field" is the the basis for power at the wall outlet at home, and the alternator in a car that keeps the battery charged.