Inverse Functions: x=f(y) and X=f^-1(y)

Click For Summary

Discussion Overview

The discussion revolves around the concept of inverse functions, specifically examining the relationships between the equations x=f(y) and x=f^-1(y). Participants explore the graphical representation of these functions and the implications of reversing input and output roles in the context of function notation and graph transformations.

Discussion Character

  • Exploratory
  • Technical explanation
  • Conceptual clarification
  • Debate/contested

Main Points Raised

  • One participant suggests that the independent variable is conventionally plotted along the horizontal axis, leading to the conclusion that x=f(y) corresponds to a specific graph orientation.
  • Another participant questions the clarity of the initial post, asking if there is a specific question being posed.
  • Some participants express confusion about how f(x)=y and f(y)=x can be derived from one another by merely reversing input and output roles, suggesting that the distinction may be more than just naming conventions.
  • It is proposed that rotating the graph of y=f(x) by 90 degrees counter-clockwise and reflecting it can yield the graph of x=f^-1(y), although some note that this approach has limitations regarding axis orientation.
  • Another viewpoint emphasizes that reflecting the graph of y=f(x) across the line y=x provides a simpler method to visualize the relationship with its inverse function.
  • Participants agree that for functions with inverses, the same points exist on both graphs, illustrating the relationship between y=f(x) and x=f^-1(y).

Areas of Agreement / Disagreement

Participants express varying levels of understanding regarding the graphical representation of inverse functions. While some agree on the methods of transformation, others question the underlying assumptions and clarity of the relationships between the functions.

Contextual Notes

There are unresolved questions regarding the implications of reversing input and output roles, as well as the conventions used in graphing these functions. The discussion does not reach a consensus on the clarity of these concepts.

DumpmeAdrenaline
Messages
80
Reaction score
2
Consider the case of a real function f for which f inverse exists.

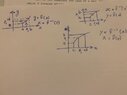
1) We we are not used to having the y-axis (vertical axis) to denote the independent variable which it does in x=f-1(y). We rotate the system through positive 90 degree and reflect about the vertical to change the sense of the axis. One further adjustment to make is to relabel the horizontal axis x and the vertical axis y (the names we give to the axes are immaterial).

If we accept the convention that the independent variable must be always plotted along the horizontal axis in the left right sense and the independent variable be called x. Then the first figure on the top left is the appropriate graph of y=f(x) and the bottom figure would be the appropriate graph for y=f^-1(x). Which figures are appropriate for these relations x=f(y) and x=f^-1(y)?

I think x=f(y) denotes the relation for the top left figure and x=f^-1(y) for the bottom figure because names to the input and output are irrelevant.
 

Attachments

  • f8f2674e-5cf1-4c78-b783-6386f9f79207.jpg
    f8f2674e-5cf1-4c78-b783-6386f9f79207.jpg
    25.1 KB · Views: 167
Last edited:
Physics news on Phys.org
Is there a question here?
 
Its stated in the study notes I am studying from that f(x)=y and f(y)=x are obtained from one another by merely reversing the roles of input and output. How is this possible? Arent both functions equal the difference between them two is what we choose to name as the input
 
DumpmeAdrenaline said:
Its stated in the study notes I am studying from that f(x)=y and f(y)=x are obtained from one another by merely reversing the roles of input and output. How is this possible? Arent both functions equal the difference between them two is what we choose to name as the input
If you draw a graph of ##y = f(x)## and then rotate the graph by 90 degrees counter-clockwise, then that is the graph of ##x = f^{-1}(y)##. It's not quite right, because the y-axis goes off to the left, rather then the right, so you also have to reflect the graph in what is now the vertical x-axis. That's just left/right convention.

Take as an example the graph of ##y = x^3##. The point ##(x=2, y=8)## is on the graph. If we rotate the graph then that becomes the point ##(y = 8, x=2)## and we see that ##x = y^{1/3}##. And, of course, the cube and cube root are inverse functions.
 
  • Like
Likes   Reactions: DumpmeAdrenaline
PeroK said:
If you draw a graph of ##y = f(x)## and then rotate the graph by 90 degrees counter-clockwise, then that is the graph of ##x = f^{-1}(y)##. It's not quite right, because the y-axis goes off to the left, rather then the right, so you also have to reflect the graph in what is now the vertical x-axis. That's just left/right convention.
A possibly simpler way to think of this is that you can reflect the graph of ##y = f(x)## across the line y = x. That will give you the graph of ##y = f^{-1}(x)##.

Assuming you start with a function that has an inverse, the graphs of ##y = f(x)## and ##x = f^{-1}(y)## are identical. The first equation gives you y as a function of x; the second equation gives you x as a (different; i.e., inverse) function of y.

Using the example given by @PeroK, the point (x=2, y = 8) lies on the graph of ##y = x^3##. Exactly the same point lies on the graph of ##x = y^{1/3}##.
 
  • Like
Likes   Reactions: DumpmeAdrenaline

Similar threads

  • · Replies 17 ·
Replies
17
Views
3K
  • · Replies 8 ·
Replies
8
Views
1K
  • · Replies 6 ·
Replies
6
Views
3K
  • · Replies 9 ·
Replies
9
Views
3K
  • · Replies 12 ·
Replies
12
Views
2K
  • · Replies 3 ·
Replies
3
Views
2K
Replies
3
Views
2K
  • · Replies 32 ·
2
Replies
32
Views
4K
  • · Replies 1 ·
Replies
1
Views
2K
  • · Replies 3 ·
Replies
3
Views
3K