Syw
- 8
- 0
- Homework Statement
- Car A traveling at a speed of 54 km/h is overtaken by car B traveling at a speed of 72 km/h. after 10 s car A begins to accelerate with an acceleration of 2.0 m/s^2 and continues until he overtakes B. How long has passed between these overtakes?
- Relevant Equations
- ..
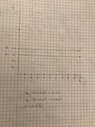
This is what I've done so far:
54 km/h = m/s
72 km/h = m/s
a = 2,0 m/s^2
A = d_1 = v * t = 15 * 10 = 150 m
B = d_2 = v * t = 20 * 10 = 200 m
d_3 = d_1 - d_2 = 200 - 150 = 50 m
Don‘t know how to continue to solve the problem.
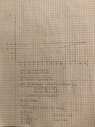
54 km/h = m/s
72 km/h = m/s
a = 2,0 m/s^2
A = d_1 = v * t = 15 * 10 = 150 m
B = d_2 = v * t = 20 * 10 = 200 m
d_3 = d_1 - d_2 = 200 - 150 = 50 m
Don‘t know how to continue to solve the problem.