Can you find a recent picture and get an average background value from it? We're already in the weeds, might as well go all the way.Andy Resnick said:Thanks! I appreciate this. However, I think my predominant source of noise is shot noise, not read noise. My night skies are not dark!
Optimizing Exposure Times: Balancing Efficiency and Image Quality
- Context: High School
- Thread starter Andy Resnick
- Start date
-
- Tags
- alignment Integration
Join the discussion
Ask a follow-up here, or get your own question answered by working scientists, mathematicians and engineers — people, not an autocomplete.
Real named experts · corrections over time · the nuance an AI answer skips
41 replies · 8K views
Astronomy news on Phys.org
- 7,806
- 4,119
I have to think about this- the original file (.NEF) is not an image, and regardless of how it's converted into an image, there is the complicated issue of tone mapping. I don't think I am able to go into the NEF file and extract information directly. What I can do (and have been doing) is using Fiji to analyze the computed 32-bit FITS image, but again that's normalized so it's not clear how much useful information can be recovered.Drakkith said:Can you find a recent picture and get an average background value from it? We're already in the weeds, might as well go all the way.
- 7,806
- 4,119
Ok, here goes:
I am going to compare 2 imaging conditions that differ only by individual exposure time: in one case, it's 8 seconds (imaging M45), and the other 20 seconds (imaging M81 and M82). For both of these cases, everything else- the camera settings (other than exposure time), lens settings, method of stacking, and total integration time- are the same.
I need to be explicit about how these image sets were generated for display and analysis: Single images began as 14-bit RAW files, which were converted into 16-bit/ch TIFF images in Astro Pixel Processor. In order to more easily visualize the comparison I originally asked about, before saving the TIFF image, the histogram was stretched.
I don't fully understand how the histogram was stretched: the technical term is "digital development processing (DDP) stretch" and I used the settings: background targeted at 30% of the dynamic range; base pedestal of 0.0%, and a black point at -2 sigma. This gives me the brightest background.
Here are the 'original images'... first, M81 & M82, then M45: (note: the first image is showing an out-of-focus tree branch, for the analysis I selected a region not occluded)


Examining the background at high magnification (images in the same order):


For these crops, I scaled the original image about 800% without interpolation to preserve the individual pixel variations and cropped to a size I can post here (800 pixels wide).
Note there are high-frequency spatial variations in both brightness and color. These are "in quadrature", so to speak, and so decreasing the saturation also reduces the overall noise.
Some numbers: the intensity variations of this patch of background, according to Fiji, are:
20s exposure time: mean = 20665, st. dev = 9355
8s exposure time: mean = 18340, st. dev = 7248
This qualitatively agrees with shot noise dominating: brighter image = more noise. But note that the mean does not linearly scale with exposure time- that's one consequence of the nonlinear DDP stretch.
Now what happens after stacking? I don't fully understand the entire algorithm, but stacking methodology was identical for both objects and my choices of parameters were typically default settings.
Here are two crops of the stacked image, prior to any post-processing (e.g. background flattening and subtraction).
M81 & M82, averaging 2185 frames (integration time = 43700 seconds):

and averaging 6225 frames for M45 (integration time = 49800s):

Fiji reports:
Averaging 2185 frames: mean = 27068, st. dev = 11510
Averaging 6225 frames: mean = 44519, st. dev = 4117
I'm not entirely sure what conclusions I can draw from this, other than "averaging more frames = decreased noise", but that's hardly a novel concept.
How's that?
I am going to compare 2 imaging conditions that differ only by individual exposure time: in one case, it's 8 seconds (imaging M45), and the other 20 seconds (imaging M81 and M82). For both of these cases, everything else- the camera settings (other than exposure time), lens settings, method of stacking, and total integration time- are the same.
I need to be explicit about how these image sets were generated for display and analysis: Single images began as 14-bit RAW files, which were converted into 16-bit/ch TIFF images in Astro Pixel Processor. In order to more easily visualize the comparison I originally asked about, before saving the TIFF image, the histogram was stretched.
I don't fully understand how the histogram was stretched: the technical term is "digital development processing (DDP) stretch" and I used the settings: background targeted at 30% of the dynamic range; base pedestal of 0.0%, and a black point at -2 sigma. This gives me the brightest background.
Here are the 'original images'... first, M81 & M82, then M45: (note: the first image is showing an out-of-focus tree branch, for the analysis I selected a region not occluded)
Examining the background at high magnification (images in the same order):
For these crops, I scaled the original image about 800% without interpolation to preserve the individual pixel variations and cropped to a size I can post here (800 pixels wide).
Note there are high-frequency spatial variations in both brightness and color. These are "in quadrature", so to speak, and so decreasing the saturation also reduces the overall noise.
Some numbers: the intensity variations of this patch of background, according to Fiji, are:
20s exposure time: mean = 20665, st. dev = 9355
8s exposure time: mean = 18340, st. dev = 7248
This qualitatively agrees with shot noise dominating: brighter image = more noise. But note that the mean does not linearly scale with exposure time- that's one consequence of the nonlinear DDP stretch.
Now what happens after stacking? I don't fully understand the entire algorithm, but stacking methodology was identical for both objects and my choices of parameters were typically default settings.
Here are two crops of the stacked image, prior to any post-processing (e.g. background flattening and subtraction).
M81 & M82, averaging 2185 frames (integration time = 43700 seconds):
and averaging 6225 frames for M45 (integration time = 49800s):
Fiji reports:
Averaging 2185 frames: mean = 27068, st. dev = 11510
Averaging 6225 frames: mean = 44519, st. dev = 4117
I'm not entirely sure what conclusions I can draw from this, other than "averaging more frames = decreased noise", but that's hardly a novel concept.
How's that?
- 7,806
- 4,119
Naturally, the second I posted the above I realized I should have Fiji analyze the unscaled images (no DDP stretch). Those numbers are:
Single frames: 20 s mean = 2481, StDev = 17; 8s mean = 2535, StDev = 6. Bollocks!
Stacked: 2185 frames -> mean = 498 StDev = 0, 6225 frames -> mean = 362 StDev = 8. OMG.
I was better off before... :(
Edit: analyzing whole frames rather than crops doesn't help much:
20s exposure mean = 2563, StDev = 15, Max = 20216; averaging 2200 of them -> mean = 497, StDev = 21, Max = 19380.
8s exposure mean = 2534, StDev = 157, Max = 65535 (saturated pixels). Averaging 6200 of them -> mean = 837, StDev = 708, Max = 65535.
Single frames: 20 s mean = 2481, StDev = 17; 8s mean = 2535, StDev = 6. Bollocks!
Stacked: 2185 frames -> mean = 498 StDev = 0, 6225 frames -> mean = 362 StDev = 8. OMG.
I was better off before... :(
Edit: analyzing whole frames rather than crops doesn't help much:
20s exposure mean = 2563, StDev = 15, Max = 20216; averaging 2200 of them -> mean = 497, StDev = 21, Max = 19380.
8s exposure mean = 2534, StDev = 157, Max = 65535 (saturated pixels). Averaging 6200 of them -> mean = 837, StDev = 708, Max = 65535.
Last edited:
Indeed, DDP does both a gamma stretch AND an unsharp mask, rendering any quantitative analysis basically impossible. At least for me.
As for your numbers from Fiji's analysis, I can't really make any sense out of them. All I did was choose a single pixel in my image for a quick analysis on. I also don't have a color camera to complicate things, just a monochrome camera with a filter wheel.
As for your numbers from Fiji's analysis, I can't really make any sense out of them. All I did was choose a single pixel in my image for a quick analysis on. I also don't have a color camera to complicate things, just a monochrome camera with a filter wheel.
- 7,806
- 4,119
In APP, I retain the saturation adjustment but do not use any sharpening option- AFAIK, in APP the histogram stretch is independent of an unsharp mask.Drakkith said:Indeed, DDP does both a gamma stretch AND an unsharp mask, rendering any quantitative analysis basically impossible. At least for me.
As for your numbers from Fiji's analysis, I can't really make any sense out of them. All I did was choose a single pixel in my image for a quick analysis on. I also don't have a color camera to complicate things, just a monochrome camera with a filter wheel.
I can't make sense of the numbers, either. I don't think the Bayer filter greatly complicates the issue (since a 16-bit/ch image is created by a 2 x 2 average of 14-bit data), but using a single pixel for analysis goes against my original query.
I used a single pixel just for simplicity. Everything I've said before still applies to your images overall. Based on my previous post where I looked at the SNR of different exposures, I'd say you benefit more from 10s subs vs 15s subs since you lose so many more images of the latter.
- 7,806
- 4,119
I think we are talking about two different types of noise.
Edit: I played around with the camera settings and kept parameterizing the frames in Fiji until I started to get consistent results...
As it happens, my original question actually concerns the effects of dark current: I found the (accurate) phrase "dark current [noise] and noise from skyglow are what is limiting faint object detection" here, see the replies by both sharkmelley and rnclark.
My camera sensor has a relatively high amount of dark current- about 1 e-/s per pixel, so mitigating this could be beneficial.
So this is possibly good- at least, it's a potential path towards image improvement.
Edit: I played around with the camera settings and kept parameterizing the frames in Fiji until I started to get consistent results...
As it happens, my original question actually concerns the effects of dark current: I found the (accurate) phrase "dark current [noise] and noise from skyglow are what is limiting faint object detection" here, see the replies by both sharkmelley and rnclark.
My camera sensor has a relatively high amount of dark current- about 1 e-/s per pixel, so mitigating this could be beneficial.
So this is possibly good- at least, it's a potential path towards image improvement.
Last edited:
Oh? Did I miss that particular question? I don't see it in the thread.Andy Resnick said:As it happens, my original question actually concerns the effects of dark current:
Oh wow. That is very high. Are you sure about that number? That would mean your dark current is comparable to, or even higher than, your target signal except perhaps on brighter DSO's. My cooled Atik One 9.0 camera has a dark current of about 0.0002 e- /s per pixel at -10 degrees c (at least that's what the datasheet says), so dark noise is negligible in most of my images.Andy Resnick said:My camera sensor has a relatively high amount of dark current- about 1 e-/s per pixel, so mitigating this could be beneficial.
Yes, dark current can have a significant effect on the quality of your images. Consider a situation in which the dark current is the same as the signal. Our noise for a single image would then be:Andy Resnick said:I found the (accurate) phrase "dark current [noise] and noise from skyglow are what is limiting faint object detection" here, see the replies by both sharkmelley and rnclark.
##noise = \sqrt{sig + dc + ron^2}##
Using our previous numbers, with 10 seconds of exposure, that's: ##noise = \sqrt{8.2 + 8.2 + 2.62 ^2} = \sqrt{16.4 + 6.86} = \sqrt{23.26} = 4.82##.
Compare this to our previous situation where we assumed negligible dark current:
##noise = \sqrt{8.2 + 2.62^2} = \sqrt{8.2 + 6.86} = \sqrt{15.06} = 3.88##
As you can see, dark current adds a significant amount of noise. Increasing it by nearly 25% in this case. Though we haven't included sky noise, so it's not quite so bad percentage-wise.
Last edited:
- 7,806
- 4,119
Ok- it took maximum effort, but I have some definite conclusions. The results are (for me) counterintuitive, so I needed to double-check and then generate some data (over the past 3 nights)
Note- I am using a DSLR and no narrow-band filters on a lens equivalent to a 100mm diameter refractive telescope. YMMV.
I first asked (what I thought) was a simple question: how many (visible band) photons emitted by a distant star are absorbed by the sensor per second? I used a combination of blackbody radiation (standardized to the sun: 43% of the emitted light is visible, the solar constant is 1361 W/m^2) and the relationship between flux and magnitude to generate a table like this:

And then convert to e-/pixel based on the (measured) FWHM size of the airy disc and assuming 50% quantum efficiency:

The next problem was to determine the amount of noise present. I gave up on this, because the specifications are not available and what I could find online was not really trustworthy (IMO). If I had to, I would estimate the total noise somewhere between 8 e- and 12 e-.
But- what I can see is that, for example imaging @ 400mm, that a magnitude 18 star should be well-separated from the noise even with 13s exposures. Not so much at 800mm, which will require longer exposures, but I can still comfortably image magnitude 16-17 objects at exposure times I can manage (typically 8-10 seconds)
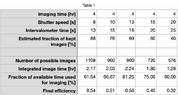
So that brings me back to my efficiency calculation: given 'H' hours acquiring images, what fraction of those images are retained for stacking? That gives me a scond table:

So what I conclude is that, at 400mm imaging, I am better off exposing for 13s rather than 20s- the increased number of images results in a lower variance of the background.
So that's what I tried: imaging at 13s ISO 200 instead of 20s ISO 64 (also: lower read noise at ISO 200 compared to ISO 64, something I don't understand....)
The resulting stacks (comparing 20s subs and 13s subs), both with equal total integration time, showed that the two stacks appear nearly identical. This was confirmed with image analysis. The major distinction is that the 13s stack had a lower variance (which is what I wanted- easier to separate out light pollution).
Anyhow.. thanks to everyone for their comments, this has been educational!
Note- I am using a DSLR and no narrow-band filters on a lens equivalent to a 100mm diameter refractive telescope. YMMV.
I first asked (what I thought) was a simple question: how many (visible band) photons emitted by a distant star are absorbed by the sensor per second? I used a combination of blackbody radiation (standardized to the sun: 43% of the emitted light is visible, the solar constant is 1361 W/m^2) and the relationship between flux and magnitude to generate a table like this:
And then convert to e-/pixel based on the (measured) FWHM size of the airy disc and assuming 50% quantum efficiency:
The next problem was to determine the amount of noise present. I gave up on this, because the specifications are not available and what I could find online was not really trustworthy (IMO). If I had to, I would estimate the total noise somewhere between 8 e- and 12 e-.
But- what I can see is that, for example imaging @ 400mm, that a magnitude 18 star should be well-separated from the noise even with 13s exposures. Not so much at 800mm, which will require longer exposures, but I can still comfortably image magnitude 16-17 objects at exposure times I can manage (typically 8-10 seconds)
So that brings me back to my efficiency calculation: given 'H' hours acquiring images, what fraction of those images are retained for stacking? That gives me a scond table:
So what I conclude is that, at 400mm imaging, I am better off exposing for 13s rather than 20s- the increased number of images results in a lower variance of the background.
So that's what I tried: imaging at 13s ISO 200 instead of 20s ISO 64 (also: lower read noise at ISO 200 compared to ISO 64, something I don't understand....)
The resulting stacks (comparing 20s subs and 13s subs), both with equal total integration time, showed that the two stacks appear nearly identical. This was confirmed with image analysis. The major distinction is that the 13s stack had a lower variance (which is what I wanted- easier to separate out light pollution).
Anyhow.. thanks to everyone for their comments, this has been educational!
Attachments

Gleb1964
- 138
- 71
Drakkith said:.. Consider a situation in which the dark current is the same as the signal. Our noise for a single image would then be:
##noise = \sqrt{sig^2 + dc^2 + ron^2}##
I think, the noise should be:
##noise = \sqrt{sig + dc + ron^2}##
Ah, yes, you are correct. Noise is either:Gleb1964 said:I think, the noise should be:
##noise = \sqrt{sig + dc + ron^2}##
##\sqrt{sig + dc + ron^2}##
in terms of signal
or
##\sqrt{shotnoise^2 + darknoise^2 + ron^2}##
in terms of noise
I've edited my previous post to correct my math. In the updated math, the dark current ends up adding 25% more noise instead of 40%.
Last edited:
Similar threads
- learningastronomy
- · Replies 7 ·
- Introductory Physics Homework Help
- Replies
- 7