Power induced shift in rotational transitions for a diatomic molecule

Click For Summary

Discussion Overview

The discussion focuses on the observed shifts in rotational transition peaks of a diatomic molecule when varying the power of the laser used to drive the transitions. Participants explore potential reasons for these shifts, considering both experimental conditions and theoretical implications, while addressing issues related to spectrometer precision and signal-to-noise ratios.

Discussion Character

  • Exploratory
  • Technical explanation
  • Debate/contested
  • Experimental/applied

Main Points Raised

  • One participant notes that the peaks shift with laser power changes, questioning the underlying reasons for this phenomenon, particularly in light of the AC Stark shift theory.
  • Several participants inquire about the precision of the spectrometer and whether the measurements were referenced to a calibrated source, suggesting that the observed shifts might be artifacts.
  • Another participant emphasizes the importance of confirming the direction of the shift and suggests graphing all data sets to visualize potential discrepancies.
  • Concerns are raised about the possibility of saturation effects at lower power levels impacting the observed signal-to-noise ratio.
  • One participant questions whether the frequency shift could be due to mechanical effects or calibration issues, urging for clarity on the experimental setup and the nature of the transitions being studied.
  • Another participant agrees that an AC Stark shift should not occur with only one laser, but suggests investigating technical issues before concluding that the molecular line has detuned.
  • Discussion includes the idea that noise from the molecular number may dominate over photon shot noise, affecting the signal-to-noise ratio.

Areas of Agreement / Disagreement

Participants express varying opinions on the causes of the observed shifts, with no consensus reached. Some suggest technical issues may be responsible, while others consider the possibility of actual shifts in the molecular transitions.

Contextual Notes

Participants mention the need to account for various experimental conditions, including potential calibration errors and the effects of temperature, which may influence the observed results.

BillKet
Messages
311
Reaction score
30
Hello! I am analyzing some data from some rotational transitions between 2 electronic energy levels in a diatomic molecule. I noticed that for different runs that covered the same regions, the peaks we observe are shifted with respect to each other when the power of the laser driving the transition is changed.

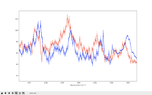
I attached 2 such scans below, where the red one has a power of the laser of 2 mW while the blue one has 0.06 mW (they are not normalized for the molecular flux).

Assuming everything else, beside the laser power is the same between the 2 runs (which might not be the case, I need to look more into it, but for now assume it is), what can be the reason for this? I know that bigger power leads to broadening, but not a shift in the central value.

Also the AC Stark shift, as far as I understand, comes when you have a second laser involved i.e. the second laser shifts the transitions that the first laser sees. But I didn't think that the AC Stark shift works with only one laser (is that the case?).

Can someone help me understand what is happening and how can I account for this shift in the analysis? Thank you!
 

Attachments

  • Screen Shot 2022-02-11 at 1.16.45 PM.png
    Screen Shot 2022-02-11 at 1.16.45 PM.png
    22 KB · Views: 192
Physics news on Phys.org
What is the expected precision of the spectrometer?? Was it referenced to a calibrated source? Why is the signal to noise not superior for the more intense laser ?
Surely looks like an artifact.
Did you "close the loop"?:i.e do a third test to duplicate the first?
 
hutchphd said:
What is the expected precision of the spectrometer?? Was it referenced to a calibrated source? Why is the signal to noise not superior for the more intense laser ?
Surely looks like an artifact.
Did you "close the loop"?:i.e do a third test to duplicate the first?
Thank you for the reply. I have 4 scans, 2 at each power, and the ones at the same power are consistent with each other, but not with the other 2. The linewidth of the laser without power broadening is around 50 MHz and the frequency was calibrated using a Rb transition.

About the SNR, I am not totally sure, but from what I saw in other scans I think the transition is saturated (or close to saturation) so reducing the power might not make the peak smaller.
 
Are you certain of the direction of the shift (the lineshapes match maybe better if the blue is pushed to the right...this may be silly for other reasons). And of course temperature is always suspect. You might also graph all four sets of data on graph with no interpolation lines but just 4 colors dots. Could show you stuff. I'm just doing a blind analysis here...don't know the system or the physics well enough
 
hutchphd said:
Are you certain of the direction of the shift (the lineshapes match maybe better if the blue is pushed to the right...this may be silly for other reasons). And of course temperature is always suspect. You might also graph all four sets of data on graph with no interpolation lines but just 4 colors dots. Could show you stuff. I'm just doing a blind analysis here...don't know the system or the physics well enough
I guess my main questions is: can (in general) a change in the laser power produce a shift in the transition frequency between 2 levels? You are absolutely right that there might be other reasons, but I kinda want to get this out of the way, as this is the most obvious change between the 2 scans.
 
Seems unlikely to me, particularly since you are apparently saturating with lower power and the line shapes seem similar. I am in no way knowledgeable about this system: hopefully somebody actually has specific experience here.
As a general comment: if you have data, there is always more information than you think. It is possible to learn things you don't even know that you don't know. Playing well with data: a very useful skill.
 
What is the molecule you are studying, and do you know what transition you are driving? What sort of system are you using to produce these molecules (a molecular beam? a vapor cell? something else?). How are you using the Rb reference to calibrate your scans, and what wavelength is your detection laser tuned (close to the Rb transition, or far from it?). The answers to these questions are important to determine whether the frequency shift is due to some mechanical effect (e.g., detecting different velocity classes) or some calibration effect (e.g., laser frequency reference drift).
 
  • Like
Likes   Reactions: Twigg
In theory, you are correct that you shouldn't see an AC Stark shift, assuming that the only thing that changed was the probe light power.

I would agree with above suggestions that you should start by looking for technical issues (laser frequency shifts, referencing problems, etc) before concluding that your molecular line has actually detuned. I would put a little bit of your probe beam onto a wavemeter and see if your frequency is correct. But of course you know your system better than we do.

hutchphd said:
Why is the signal to noise not superior for the more intense laser ?
BillKet said:
About the SNR, I am not totally sure,
The noise on the molecule number probably dominates over the noise from photon shot noise. Even if you normalized by molecule number, the shot noise from the detector's quantum efficiency would probably exceed the photon shot noise, unless you were counting molecules nearly exactly.
 
  • Like
Likes   Reactions: hutchphd

Similar threads

  • · Replies 6 ·
Replies
6
Views
3K
  • · Replies 8 ·
Replies
8
Views
4K
  • · Replies 0 ·
Replies
0
Views
3K
Replies
7
Views
3K
  • · Replies 9 ·
Replies
9
Views
5K
  • · Replies 1 ·
Replies
1
Views
1K
  • · Replies 1 ·
Replies
1
Views
2K
  • · Replies 2 ·
Replies
2
Views
2K
  • · Replies 6 ·
Replies
6
Views
3K
  • · Replies 4 ·
Replies
4
Views
3K