Problems with plotting a function in Maple

2 replies · 3K views · last reply
EdisT
Messages
17
Reaction score
0
Hey so I'm working on a simulation to compute the multiplicity of two Einstein solids.. long story short I'm having a tough time plotting a function. To start, I defined the following:


Typeset formula: P(q, N) := ((q + N - 1)!) / (q! (N - 1)!), defining a function of q and N using factorials.


Maple input line defining M as the product of P(100 - x, 200) and P(x, 300).

Which, when simplified yields:
Maple-rendered mathematical expression: 2.4858 times 10^-985 times (299 - 1x)! times (x + 299)!, all divided by (100 - 1x)! times x!.

I named this simplified result K:
Maple-typeset formula defining K as 2.4858 times 10 to the power of minus 985, times (299 minus 1x) factorial, times (x plus 299) factorial, divided by (100 minus 1x) factorial, times x factorial.

Plotting this...
Maple input command plot(K, x = 0..100), plotting the function K over x from 0 to 100.


What I get is
Empty Maple plot with x-axis from 0 to 100 labelled x and y-axis from -10 to 10, with no curve drawn.


However if I don't define my axis, Maple yields the following:
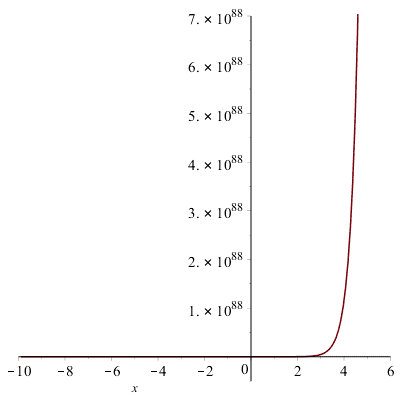
Plot of an exponential-looking curve over x from -10 to 6, near zero until about x = 3, then rising steeply to 7 × 10^88 at the right edge of the axes.


This is fine, except I would like x to go from 0 to 100 and y to go from 0 to 2E96 (which when computed by hand yields actual results close to the boundaries of that range). However if I manually go into the axes definition of the image above, and change it to the desired values, I get:
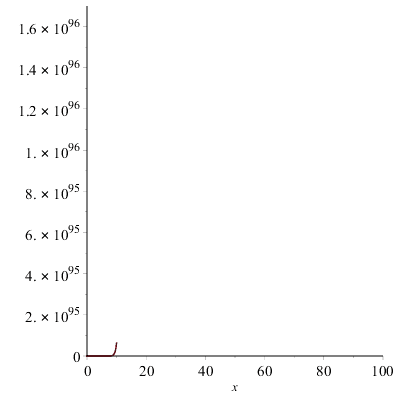
Maple plot with x-axis from 0 to 100 and y-axis from 0 to 1.6e96; a dark curve rises steeply only from x of about 0 to 10, reaching about 1e95 near x = 10, and is flat near zero elsewhere.


So the plot is not defined at any value outside of whatever Maple decided it should be: I can only change the axes values but not the range and domain of the actual function.. any ideas?
 
You could try plotting it using smaller constants just to see if its the function itself somehow.

It may be that even a small increment in x is either 0 or skyrockets way beyond the range limits hence you see no plot line. Can you change the plot line color that way you would see the line drawn over the x-axis until it takes off toward the moon.

Or can you zoom into the plot that is made until you've reached the domain and range you want. You''ll probably find the same result and that the software is working as designed.

Also have you tried it in MATLAB? Its pretty good about plotting things.
 
Last edited:
I ended up plotting in Mathematica after starting from MATLAB (which didn't work because it approximates infinity at around 7E96 I think, and even when I divided it by 1E96 it would first calculate the factorial, approximate it to infinity, then say infinity divided by a large-ish number is "NaN"). Then I tried to plot it with Maple.. didn't work because of it's approximation of infinity. Tried to do it in Python .. same reason. Ended with Mathematica.. it works wonders :D