Question about spectrometer data

  • Context: Undergrad 
  • Thread starter Thread starter DariusP
  • Start date Start date
  • Tags Tags
    Data Spectrometer
Join the discussion
Ask a follow-up here, or get your own question answered by working scientists, mathematicians and engineers — people, not an autocomplete.
Real named experts · corrections over time · the nuance an AI answer skips
1 reply · 2K views
DariusP
Messages
50
Reaction score
3
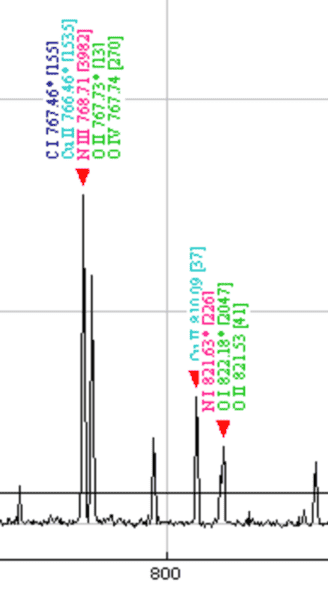
Hello, I want to ask about this picture. This is a one bit of plasma spectrum from copper plate. Does anyone know what those romanic numbers (I, II, III) mean or what those numbers in [ ] mean? Also why am I seeing multiple element names on a single peak? I am so confused...
P.S. The x-axis is wavelength, and y-axis is intensity.
upload_2018-12-9_19-10-10.png
 

Attachments

  • upload_2018-12-9_19-8-47.png
    upload_2018-12-9_19-8-47.png
    15.6 KB · Views: 432
  • upload_2018-12-9_19-10-10.png
    upload_2018-12-9_19-10-10.png
    11.6 KB · Views: 559
Physics news on Phys.org
The Roman numerals are used to denote the ionization state of the atoms where the transition is occurring. I means a neutral atom. II means an atom with one electron removed. III means an atom with two electrons removed, and so on. So O-IV is an oxygen atom with 3 electrons removed. N-III is a nitrogen atom with two electrons removed, and so forth. There are multiple lines on those peaks because the wavelengths are so close together. The line may be anyone of those lines, or (more likely) a combination. I'm not sure what the numbers in brackets refer to, but I think they denote the strength of the lines.