Discussion Overview
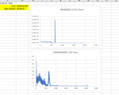
The discussion revolves around the comparison of experimental results with those obtained from the MCBEND simulation. Participants explore the need for normalization of graphs to achieve similarity between the two sets of results, addressing both the methodology and the context of the data.
Discussion Character
- Exploratory
- Technical explanation
- Debate/contested
Main Points Raised
- One participant questions whether normalization is necessary to make the experimental and simulation graphs similar, seeking guidance on how to apply it.
- Another participant suggests that normalization might be useful if the simulation results have not been scaled to match the experimental results, indicating that the normalization approach depends on the specific data analysis goals.
- A participant expresses uncertainty about how to perform normalization, indicating that their experimental graph does not match the theoretical one in shape, which may complicate the comparison.
- One participant mentions that their code is consistent with the simulation environment and that they are investigating the accuracy of the simulation based on detector measurements.
Areas of Agreement / Disagreement
Participants express differing views on the necessity and method of normalization, with some suggesting it is essential while others indicate that the inherent differences in graph shapes may prevent a satisfactory match regardless of normalization efforts. The discussion remains unresolved regarding the best approach to achieve similarity between the graphs.
Contextual Notes
There are limitations regarding the assumptions made about the data and the specific goals of the analysis, which have not been fully clarified. The discussion also highlights the potential impact of the shape of the graphs on the normalization process.