Testing/proving X-bar oof an exponential distribution

Join the discussion
Ask a follow-up here, or get your own question answered by working scientists, mathematicians and engineers — people, not an autocomplete.
Real named experts · corrections over time · the nuance an AI answer skips
1 reply · 2K views
kadaj6
Messages
31
Reaction score
0
ok, so I have a list of students with GPA, I checked the probability plot and I think its a Exponential distribution, take a look:
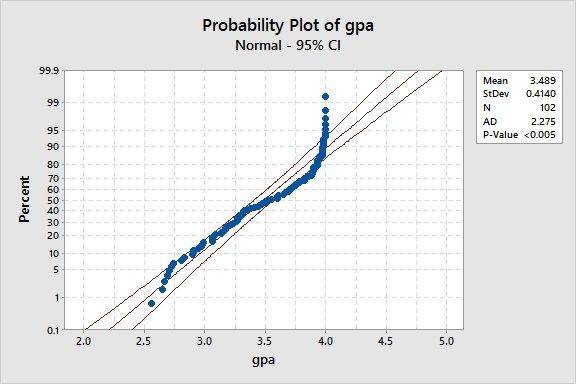
Probability Plot of gpa.jpg


So I am given a χ-bar to prove, and I have to prove or test it with three different types of test, I don't know which ones or how to do them in miniTab software.

please help me.
 
Physics news on Phys.org
That plot looks odd to me - it certainly does not look like a probability distribution.
i.e. if it were then the probability of getting a 4.0gpa is 0.99... did nearly everyone get a high gpa?

The "percent" on the vertical axis - what is it a percent of?

The curve looks like an inverse cumulative-normal.

Finally - are you asking about chi-bar or x-bar?
You appear to have supplied an incomplete problem statement - what are you supposed to "prove"?
Do you know of any tests that may fit the bill?