Use Excel to find the similarity between functions.

2 replies · 2K views · last reply
24forChromium
Messages
155
Reaction score
7
I am writing a paper and I came up with a function that uses a hypothetical relationship to predict the value of one variable at different points in time, I graphed it, and then graphed the actual readings from an experiment. How can quantitatively describe how close the two trends are? In other words, how can I quantitatively describe the amount of support the hypothetical relationship get from the experiment? See image for more ideas, predictive function gives values in blue, actual readings are orange.
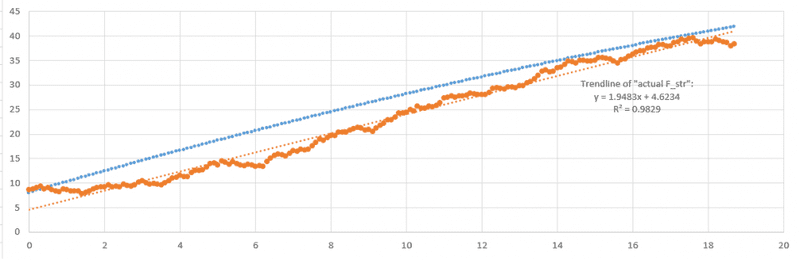
Line chart with x-axis from 0 to 20 and y-axis from 0 to 45: a blue dotted line rising steadily from about 8 to 42, and an orange jagged series rising from about 8 to 38, with an orange dotted linear trendline labelled y = 1.9483x + 4.6234, R^2 = 0.9829.
 
You can get the confidence intervals for the slope and intercept of the regression line. For a given confidence level, your theoretical parameters will be in or out of the confidence interval. Just eyeballing the data, the regression line, and your theoretical line, I think there is something missing from your theory. I think it is likely to be statistically rejected.