What software do you use for creating good quality TABLES....

  • Thread starter Thread starter rwooduk
  • Start date Start date
  • Tags Tags
    Quality Software
Join the discussion
Ask a follow-up here, or get your own question answered by working scientists, mathematicians and engineers — people, not an autocomplete.
Real named experts · corrections over time · the nuance an AI answer skips
15 replies · 10K views
rwooduk
Messages
757
Reaction score
59
... in scientific papers?

I'm having a real problem with Microsoft Word getting all the information I need onto the graph, it takes up too much room, example:

My attempt a TABLE in Word:
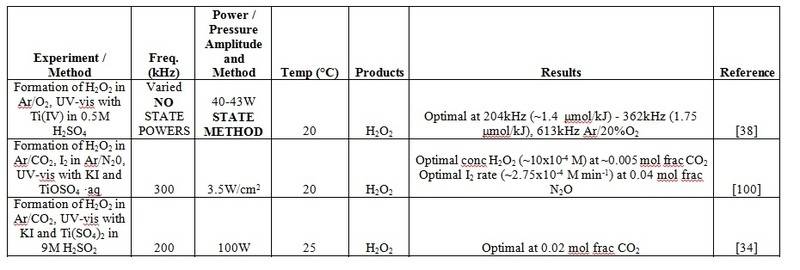
uYSlnkQ.jpg


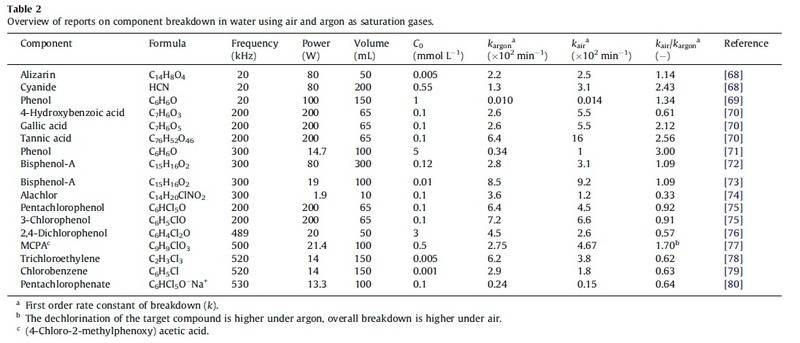
How I want it to look:

jJPpkvj.jpg


So just wondering what you guys use, or how you would go about creating the latter TABLE?
 
Last edited:
on Phys.org
Put it all on a spreadsheet instead . You then have almost complete formatting control . You can even have active data management and calculations if you want .
 
  • Like
Likes   Reactions: rwooduk
Nidum said:
Put it all on a spreadsheet instead . You then have almost complete formatting control . You can even have active data management and calculations if you want .

I did the above TABLE in Excel and copied and pasted it into Word, but find it looks nothing like the TABLES in scientific papers, they are usually without borders around the cells (like the above). I was wondering if there is some software that scientists generally use for making these tyoes of TABLES?Thanks for the advice though!
 
Perhaps calling graph a table will help ;)
 
  • Like
Likes   Reactions: rwooduk
Borek said:
Perhaps calling graph a table will help ;)

haha that's a really good point, too much reading can no longer think clearly
 
Nidum said:
You can add and remove border lines as part of the formatting .

hmm okay, I will try again! thanks
 
You can produce any combination of borders you want, in a variety of styles. It's just a matter of selecting different groups of cells and fiddling with the options. In Excel 2011 for Mac, they're under Format --> Cells, then the Borders tab.

Your table 2 above could be formatted in two steps:

1. Select the header row, then go to the Borders tab and turn off all borders except top and bottom.

2. Select the data rows all together, then do the same as above in the Borders tab.
 
  • Like
Likes   Reactions: rwooduk
Office has always been a terrible offender at not formatting things correctly, or minor changes completely screwing up the format. LaTeX is most commonly used to remedy this, it's a typesetting engine and nothing more. While Word tries to be everything a word processor needs and does it okay, LaTeX takes one very specific part of that: the rendering of text and mastered it. There are WYSIWYG editors written on top of that framework. It's used for a huge majority of scientific textbooks published in the last 30 years.
 
  • Like
Likes   Reactions: rwooduk
rwooduk said:
... in scientific papers?

I'm having a real problem with Microsoft Word getting all the information I need onto the graph, it takes up too much room, example:

My attempt a TABLE in Word:

uYSlnkQ.jpg


How I want it to look:

jJPpkvj.jpg


So just wondering what you guys use, or how you would go about creating the latter TABLE?

Table 1 is rather wordy in its content, while Table 2 pretty much contains only simple facts. Of the 2 tables, the latter would be the easier to format, using Word, Excel, or some other means. Table 1 can be cleaned up a bit, perhaps by changing fonts and working with inter-cell formatting options, but it probably would not look like Table 2 even with this extra work.
 
rwooduk said:
... in scientific papers?

I'm having a real problem with Microsoft Word getting all the information I need onto the graph, it takes up too much room, example:

My attempt a TABLE in Word:

uYSlnkQ.jpg


How I want it to look:

jJPpkvj.jpg


So just wondering what you guys use, or how you would go about creating the latter TABLE?
The table from the paper is very very likely created in LaTeX. It's much easier to make professional looking tables etc with LaTeX.
 
  • Like
Likes   Reactions: rwooduk
e.bar.goum said:
The table from the paper is very very likely created in LaTeX. It's much easier to make professional looking tables etc with LaTeX.
I am a big fan of LaTeX, too, but creating and formatting tables is certainly not one of its strengths. There are zillions of packages which promise to provide "professional" looking tables, but mostly, they cover only few of the aspects of the table you want or have to create. E.g. I had notoriously problems to get correct formatting when using footnotes inside the tables.
 
  • Like
Likes   Reactions: rwooduk
DrDu said:
I am a big fan of LaTeX, too, but creating and formatting tables is certainly not one of its strengths. There are zillions of packages which promise to provide "professional" looking tables, but mostly, they cover only few of the aspects of the table you want or have to create. E.g. I had notoriously problems to get correct formatting when using footnotes inside the tables.

That's a good point (as the half hour I spent making a table that spans the width of a column of text the other day). I'd still say that I'm 99.9% sure the above table is LaTeX, and that the results look professional once you've got it right. Perhaps it's not easier than other options, but dang, they can look good.
 
  • Like
Likes   Reactions: rwooduk
e.bar.goum said:
That's a good point (as the half hour I spent making a table that spans the width of a column of text the other day). I'd still say that I'm 99.9% sure the above table is LaTeX, and that the results look professional once you've got it right. Perhaps it's not easier than other options, but dang, they can look good.
The table above contains quite a lot of points which need quite advanced knowledge of latex: alignment on the decimal point, roman formatting of the chemical formulas, footnotes in the table. Nevertheless, the table is probably to broad for one page. The latex code for creating this table will be almost ininintelligible in a text editor and therefore difficult to manage.
 
  • Like
Likes   Reactions: rwooduk
DrDu said:
The table above contains quite a lot of points which need quite advanced knowledge of latex: alignment on the decimal point, roman formatting of the chemical formulas, footnotes in the table. Nevertheless, the table is probably to broad for one page. The latex code for creating this table will be almost ininintelligible in a text editor and therefore difficult to manage.
I don't disagree. Latex formatting of tables can be pain (I think less of a pain than you're making it out to be, but each to their own). And yet, there don't seem to be better options around.
 
  • Like
Likes   Reactions: rwooduk
To produce really good professional quality presentations with text , mathematical expressions , tables , graphs , diagrams , technical drawings and pictures all formatted exactly as you want on one page use CAD .

I believe that there are special versions of CAD for this purpose but most professional standard versions have all the required facilities .
 
  • Like
Likes   Reactions: rwooduk