TachyonLord
- 54
- 6
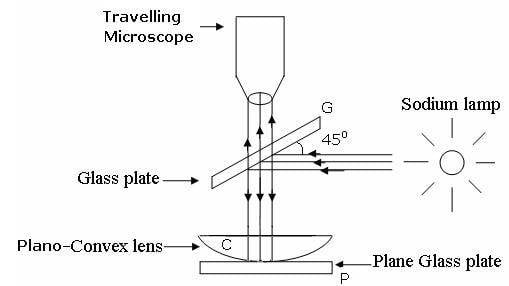
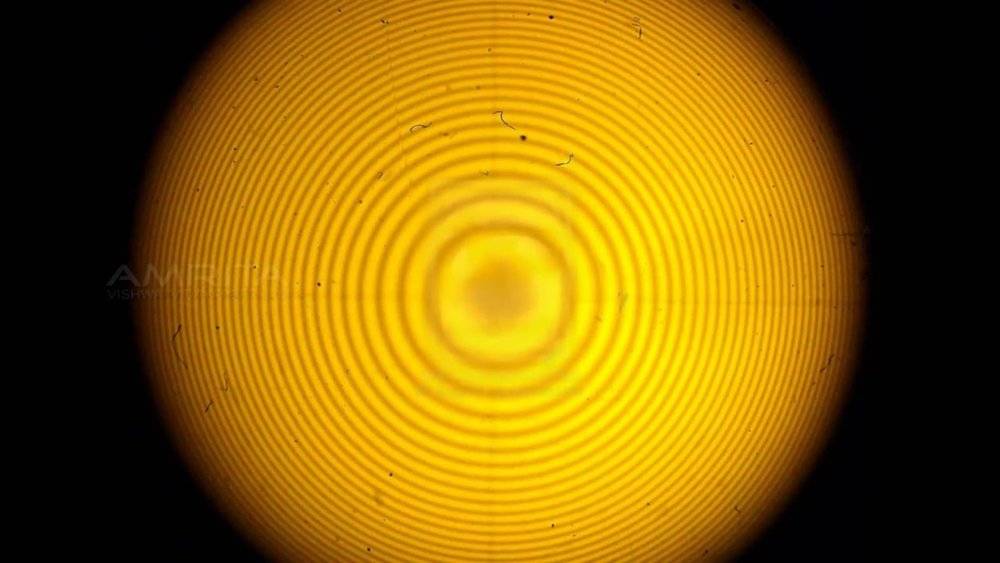
When monochromatic light is incident on a plano convex lens(as shown in the picture), these dark rings are produced which are observed with the help of a traveling microscope.
The procedure requires us to measure the diameter of each ring (We need to measure the diameter of at least 10 rings).
This is done by noting down the microscope reading at the left and right end of the ring and then subtracting the readings. The aim of the experiment is to calculate the radius of curvature of the given lens(which can also be done using a spherometer and we also do that to verify the result)
The radius is calculated using the formula $$ R = \frac {D^2_n - D^2_m} {4(n-m)λ} $$ where λ is the wavelength of the light used (For sodium, it is 589.3nm)
As a result, if we plot a graph as D2 vs n(where n is the ring number), we get a straight line.
As a result the formula can be simplified to $$ R = \frac {c} {4λ} $$
where c is the slope
The problem I'm encountering is that I get a very very nice fit for my graph, its almost a perfectly fitted straight line but the slope that I get is much much larger as compared to what we are supposed to get. When I tried to measure the radius using a spherometer, I got around 147cm which is really far from the radius that I get using the graph.
In order to get anything about 140cm, the slope from the graph should be around 0.03 but I get 0.218 which is really really far (and incorrect if you may but the straight graph just messes up my intuition).
I'll attach the graph:
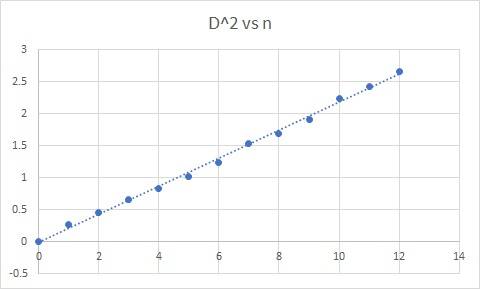
The radius found using the spherometer is much more likely to be correct but the graph that I got from my set of observations is near perfect too. It would be extremely wonderful if anyone could find out what is wrong or where I went wrong. I can't really ask my profs now because uni is closed for a week.
Thank you!
The procedure requires us to measure the diameter of each ring (We need to measure the diameter of at least 10 rings).
This is done by noting down the microscope reading at the left and right end of the ring and then subtracting the readings. The aim of the experiment is to calculate the radius of curvature of the given lens(which can also be done using a spherometer and we also do that to verify the result)
The radius is calculated using the formula $$ R = \frac {D^2_n - D^2_m} {4(n-m)λ} $$ where λ is the wavelength of the light used (For sodium, it is 589.3nm)
As a result, if we plot a graph as D2 vs n(where n is the ring number), we get a straight line.
As a result the formula can be simplified to $$ R = \frac {c} {4λ} $$
where c is the slope
The problem I'm encountering is that I get a very very nice fit for my graph, its almost a perfectly fitted straight line but the slope that I get is much much larger as compared to what we are supposed to get. When I tried to measure the radius using a spherometer, I got around 147cm which is really far from the radius that I get using the graph.
In order to get anything about 140cm, the slope from the graph should be around 0.03 but I get 0.218 which is really really far (and incorrect if you may but the straight graph just messes up my intuition).
I'll attach the graph:
The radius found using the spherometer is much more likely to be correct but the graph that I got from my set of observations is near perfect too. It would be extremely wonderful if anyone could find out what is wrong or where I went wrong. I can't really ask my profs now because uni is closed for a week.
Thank you!
Attachments


