Drawing PV diagram from data

  • #1
Samir_Khalilullah
8
0
Homework Statement
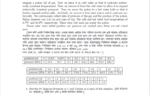
Imagine a piston full of gas. First we place it in cold water so that it contracts isothermally (constant temperature). Then we remove it from the cold water to allow it to expand isobarically (constant pressure). Then we move the piston to a hot water bath so that it further expands isothermally. And lastly we remove it from heat source and it contracts isobarically. We continuously collect data of pressure of the gas and the position of the piston. Piston diameter was 3.25 cm and mass of 35g. The cold and hot water had temperatures of 8.7°C and 58.3°C respectively. There were 0.05 mole gas inside the piston. Please note: Here initial position and pressure are marked zero, these are not actual zero.

(see data in the attachments)

A) Plot the PV diagram of the situation
Relevant Equations
## P V = n R T ##
I don't really know how to start here
 

Attachments

  • gas.png
    gas.png
    92 KB · Views: 11
Physics news on Phys.org
  • #2
What does the plot show?
 
  • #3
Begin by identifying which set of data is which process.
 
  • Like
Likes Samir_Khalilullah
  • #4
What is the weight of the piston in N?
What is the area of the cylinder in m^2?
What is the pressure contributed by the piston in Pa? in kPa?

Do they really mean that you have a piston full of gas, or that you have a cylinder full of gas covered by a piston?

In the third set of numbers, there are negative pressures. How can that be?
 
Last edited:
  • #5
Chestermiller said:
In the third set of numbers, there are negative pressures. How can that be?

Hello Chet !
Apparently there is a constant omitted in both p and V

Samir_Khalilullah said:
Homework Statement: Imagine a piston full of gas ...

Please note: Here initial position and pressure are marked zero, these are not actual zero.
 
  • #6
Samir_Khalilullah said:
I don't really know how to start here

Dear @Samir_Khalilullah,

All we can see is that the exercise asks you to plot ##p## versus ##V##. That's pretty clear, isn't it ?
What stops you from posting your result ?

I suppose there is more to come, but telepathy isn't very developed in the PF community. Guessing is usually missing.
So please show us your plot and parts B) and onwards ...

:smile:

##\ ##
 
  • #7
Plot the raw data as a scatter plot. This will give you some significant information.
1708609828150.png
 
  • #8
Did the same thing. But actually, it's @Samir_Khalilullah 's job to do that, even before posting this exercise !

##\ ##
 
  • Like
Likes Chestermiller
  • #9
Are we to assume that the given pressure values in kPa are gauge pressure? That will make a difference because in a pV diagram the pressure is normally absolute.
 
  • #10
@BvU, @kuruman The OP seems to have lost interest in this problem.

I'm inviting you and any other interested members to submit solutions to this.
 
  • #11
I find the wording rather weird: Isothermal contraction, isothermal expansion where I expect a ##\Delta T\ne 0## ?
And a pV diagram similar to that of a Brayton cycle

1708952674816.png

##\ ##
 
  • Like
Likes Chestermiller
  • #12
BvU said:
I find the wording rather weird: Isothermal contraction, isothermal expansion where I expect a ##\Delta T\ne 0## ?
And a pV diagram similar to that of a Brayton cycle

View attachment 340884
##\ ##
The left set of points is at constant temperature 8.7C, the top set of points is at constant pressure, the rights set of points is at 58.3 C, and the bottom set off points is at constant pressure.
 
  • #13
BvU said:
I find the wording rather weird: Isothermal contraction, isothermal expansion where I expect a ##\Delta T\ne 0## ?
If you replace isothermal with adiabatic it becomes a description of the heat engine cycle in a freshman lab exercise that is part of the RealTime Physics lab curriculum.

Perhaps either the instructor or the student made a goof.
 
  • #14
Chestermiller said:
to submit solutions to this

Well, we've done part A) of the exercise -- except that we haven't calibrated the axes .

I have pV = nRT = 117 J on the left and 138 J on the right.
With ##\Delta V / A\approx 4.5## cm so ##\Delta V\approx 3.7 \times 10^{-5}## m3 that would set p to some 5.5 Bara. Don't know how to connect that to the p axis...

1708958600392.png


##\ ##
 
  • #15
Let x be the piston location in cm relative to the offset origin 0,0 in the figure and let y be the value of the pressure at 0,0. Using the ideal gas law at constant pressure, we have $$\frac{4.5+x}{x}=\frac{273.2+58.3}{273.2+8.7}$$This gives x=25.6 cm, and an actual volume at y=0, T=8.7 C of ##\pi (1.625)^2(25.6)=212.4\ cc =0. 2124\ liters##. The volume at the lowest pressure y =0 and T=58.3 C is then 0.244 liters.

I think that there is a typo in the problem statement. I think the number of moles should be 0.5, not 0.05
 
Last edited:
  • #16
Chestermiller said:
Let x be the piston location in cm relative to the offset origin 0,0 in the figure and let y be the value of the pressure at 0,0. Using the ideal gas law at constant pressure, we have $$\frac{4.5+x}{x}=\frac{273.2+58.3}{273.2+8.7}$$This gives x=25.6 cm, and an actual volume at y=0, T=8.7 C of ##\pi (1.625)^2(25.6)=212.4\ cc =0. 2124\ liters##. The volume at the lowest pressure y =0 and T=58.3 C is then 0.244 liters.

I think that there is a typo in the problem statement. I think the number of moles should be 0.5, not 0.05
I followed the same procedure as you and got the same number for the volume offset.
I then added the correction factor to the volumes and proceeded to find the pressure offset. To do that
  • I took the intersection points of the low pressure isobar with the two isotherms. These were raw data points (0,0) and (4.5, 21.5).
  • I calculated the pressure at these two points from ##p=\frac{nRT}{V}## with the ##V## the corrected volume, ##T## the high and low isotherm temperatures converted to Kelvin and ##n=0.05.##
  • I got ##p_1=510~##kPa. I added this offsets to all the pressures to get the corrected pV plot shown below (no suppressed zeroes).
I note that, unless I made a mistake somewhere, the pressures are quite high relative to atmospheric and the 35 gram piston will be shot out faster than a speeding bullet. Now what?

ThermoCycle.png
 
  • #17
kuruman said:
I followed the same procedure as you and got the same number for the volume offset.
I then added the correction factor to the volumes and proceeded to find the pressure offset. To do that
  • I took the intersection points of the low pressure isobar with the two isotherms. These were raw data points (0,0) and (4.5, 21.5).
  • I calculated the pressure at these two points from ##p=\frac{nRT}{V}## with the ##V## the corrected volume, ##T## the high and low isotherm temperatures converted to Kelvin and ##n=0.05.##
  • I got ##p_1=510~##kPa. I added this offsets to all the pressures to get the corrected pV plot shown below (no suppressed zeroes).
I note that, unless I made a mistake somewhere, the pressures are quite high relative to atmospheric and the 35 gram piston will be shot out faster than a speeding bullet. Now what?

View attachment 340944

Did I make a mistake on the high volume end? I gat 244 cc compared to your 249 cc?

I don't think they meant for the piston to be providing all the pressure. I think they meant for external pressure to be applied on the piston, and for the external pressure to be increasing during the isothermal expansion at the left, and decreasing during the isothermal compression on the right. Also, the pressure applied bu the weight of the piston is a tiny 0.4 kPa (insignificant).

There is a problem with using 0.05 as the number of moles. Along the isothermal segments on the left and right, the product of PV will not be constant. Or, put another way, if you consider PV constant, and calculate the V values along the left and right sequences, the predicted volumes will significantly deviate downward from the observed values. Try again with 05 moles and see what you get.
 
  • #18
Chestermiller said:
There is a problem with using 0.05 as the number of moles. Along the isothermal segments on the left and right, the product of PV will not be constant. Or, put another way, if you consider PV constant, and calculate the V values along the left and right sequences, the predicted volumes will significantly deviate downward from the observed values. Try again with 05 moles and see what you get.
I plotted pV vs. measurement number for 6 data points for the high and low temperature isotherms. I put a linear regression for each and varied ##n## by eye until I got slopes close to zero. That gave me a value ##n=1.085.## The plot is shown below. The second plot is the entire cycle for this new value of ##n## and is the old plot with the pressure axis rescaled.

I don't think there is more to be done with this.


Isotherms.png

ThermoCycle.png
 
  • Like
Likes Chestermiller
  • #19
kuruman said:
I plotted pV vs. measurement number for 6 data points for the high and low temperature isotherms. I put a linear regression for each and varied ##n## by eye until I got slopes close to zero. That gave me a value ##n=1.085.## The plot is shown below. The second plot is the entire cycle for this new value of ##n## and is the old plot with the pressure axis rescaled.

I don't think there is more to be done with this.


View attachment 340949
View attachment 340950
At 8.7 C, a PV value of 2350 J corresponds to a number of moles of ##\frac{PV}{RT}=0.97\ moles##.

AT 58.3 C, a PV value of 2750 J correspond to a number of moles of ##\frac{PV}{RT}= 1.00\ moles##.

So your results confirm that the number of moles should be >>0.05 moles, and, instead is about equal to 1.0 mole.
 
  • #20
Chestermiller said:
So your results confirm that the number of moles should be >>0.05 moles, and, instead is about equal to 1.0 mole.
It looks that way. I tried putting solid theoretical lines over the discrete data points for the entire cycle. Limited success so far. It's time-consuming.
 
  • Like
Likes Chestermiller
  • #21
kuruman said:
It looks that way. I tried putting solid theoretical lines over the discrete data points for the entire cycle. Limited success so far. It's time-consuming.
I think we've taken this about as far as it can be taken.
 
  • Like
Likes kuruman
  • #22
Chestermiller said:
I think we've taken this about as far as it can be taken.
I agree especially when there appear to be more parts to the problem. The plot is only part A.
 

Similar threads

  • Introductory Physics Homework Help
Replies
10
Views
1K
  • Introductory Physics Homework Help
Replies
3
Views
730
Replies
11
Views
1K
  • Introductory Physics Homework Help
Replies
7
Views
636
  • Introductory Physics Homework Help
Replies
5
Views
471
  • Introductory Physics Homework Help
Replies
9
Views
812
  • Introductory Physics Homework Help
Replies
27
Views
422
Replies
207
Views
3K
  • Introductory Physics Homework Help
Replies
3
Views
2K
  • Introductory Physics Homework Help
Replies
6
Views
786
Back
Top