Help with Bode plot simulation using Simetrix

In summary, the conversation revolves around simulating a circuit without closing the loop directly from the output to the input and getting a Bode Plot of the transfer function with a signal source driving the input. The goal is to predict the oscillation frequency and compare the results between an ideal op-amp and a real op-amp. There is also discussion about verifying the oscillation condition and analyzing the loop gain and phase for the real op-amp model. Finally, there is mention of a graph on the manufacturer's data sheet that is not accurate enough for calculating the real phase shift within the loop.
  • #1
Callum Plunkett
27
8
Homework Statement
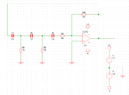
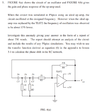
I have been given an assignment relating to RC phase shift oscillators. For me to confirm my findings I require a bode plot read out. However, after many attempts, countless videos and reading material I am still unable to achieve anything. Can some kind person point me in the right direction?.
Relevant Equations
Drawings attached.
1642530910058.png

1642530991472.png

1642531041362.png
 

Attachments

  • 1642530649865.png
    1642530649865.png
    13.8 KB · Views: 98
  • 1642530667852.png
    1642530667852.png
    12.1 KB · Views: 86
  • 1642530683268.png
    1642530683268.png
    30.5 KB · Views: 126
Physics news on Phys.org
  • #2
I would start by simulating the circuit without closing the loop directly from the output to the input. Get the Bode Plot of the transfer function with a signal source driving the input first, then you can close the loop and run a transient plot to see if it starts up and oscillates. What are you looking for on the initial Bode plot to predict where the oscillation frequency should be? :smile:
 
  • Like
Likes Callum Plunkett
  • #3
BTW, the Bode plot that is included in the problem appears to be the open-loop gain of a unity-gain stable opamp by itself. It's definitely not the Body plot they are asking you to find...
 
  • Like
Likes Callum Plunkett
  • #4
berkeman said:
I would start by simulating the circuit without closing the loop directly from the output to the input. Get the Bode Plot of the transfer function with a signal source driving the input first, then you can close the loop and run a transient plot to see if it starts up and oscillates. What are you looking for on the initial Bode plot to predict where the oscillation frequency should be? :smile:
Thanks for the reply! I’ve calculated the frequency of oscillation of about 65kHz. I was hoping to graph both an ideal op-amp and a TH072 op-amp and compare them. Another issue I’m having is with the unwanted capacitances within the TL072 and how to determine the value of them. Unfortunately, op-amps are not something I deal with day to day so I am struggling a lot with this particular subject.
 
  • #5
* At first, you should verify if the oscillation condition (Barkhausen) is fulfilled: Loop gain (somewhat larger than) unity with zero phase shift at the desired frequency fo.
* For this purpose, the loop gain (gain of the complete open loop) has to be analyzed (ac analysis, magnitude and phase) . You should open the loop at the node left to C3 for injecting an ac test signal.
* This analysis should be made for the ideal as well as real opamp model. You will notice a remarkable difference - caused by the unwanted (but unavoidable) reduced open-loop gain Aol as well as phase shift introduced by the real opamp model (if it is a good and realistic model).
* For this purpose, you should not use the graph as contained in the data sheet (and reproduced in your contribution). The graph shows a parasitic phase shift (at 65kHz) of zero deg which is not correct (too rough). To verify the real contribution of the opamp model you should perform a separate ac anylysis of the opamps open-loop gain Aol and phase response .
 
Last edited:
  • Informative
  • Like
Likes Callum Plunkett and berkeman
  • #6
LvW said:
* At first, you should verify if the oscillation condition (Barkhausen) is fulfilled: Loop gain (somewhat larger than) unity with zero phase shift at the desired frequency fo.
* For this purpose, the loop gain (gain of the complete open loop) has to be analyzed (ac analysis, magnitude and phase) . You should open the loop at the node left to C3 for injecting an ac test signal.
* This analysis should be made for the ideal as well as real opamp model. You will notice a remarkable difference - caused by the unwanted (but unavoidable) reduced open-loop gain Aol as well as phase shift introduced by the real opamp model (if it is a good and realistic model).
* For this purpose, you should not use the graph as contained in the data sheet (and reproduced in your contribution). The graph shows a parasitic phase shift (at 65kHz) of zero deg which is not correct (too rough). To verify the real contribution of the opamp model you should perform a separate ac anylysis of the opamps open-loop gain Aol and phase response .
Yeah I thought that 65kHz was abit off as I calculated the single stage phase angle as 68 degrees each for the RC ladder network, when I was hoping for something along the lines of 60 degrees. Thanks for the pointers, I am going to make an attempt tomorrow.
 
  • #7
LvW said:
* For this purpose, you should not use the graph as contained in the data sheet (and reproduced in your contribution). The graph shows a parasitic phase shift (at 65kHz) of zero deg which is not correct (too rough).
That plot is on the manufacturer data sheet for the TL072 Op-Amp. It shows the phase shift as 90° at 65kHz.

Cheers,
Tom
 
  • #8
Tom.G said:
That plot is on the manufacturer data sheet for the TL072 Op-Amp. It shows the phase shift as 90° at 65kHz.

Cheers,
Tom
Yes - I know.
However, as I have mentioned (and as you can see), this diagramm is not exact enough for calculating the real phase shift within the loop. The simulation model is much more exact.
 
  • #9
Callum Plunkett said:
Yeah I thought that 65kHz was abit off as I calculated the single stage phase angle as 68 degrees each for the RC ladder network, when I was hoping for something along the lines of 60 degrees. Thanks for the pointers, I am going to make an attempt tomorrow.
It’s been a while (sick family member and so on..) but I’ve finally found some time to give this another go. I recreated both circuits and inserted a bode plot, to the left of C3 to gain the following graphs. I’m not 100% certain that I have all the settings for the simulation set correctly or in a manner that would make the results clearer or even correct. Hopefully I’m somewhere near.
1645450661070.png


1645450598547.png
 
  • #10
..."both circuits..." What is the difference?
Circuit diagrams and both graphs are hard to read.
Which variables are shown in the diagrams?
Loop gain?
What is your outcome?
 

1. What is a Bode plot and why is it important in circuit simulation?

A Bode plot is a graphical representation of the frequency response of a circuit. It shows how the amplitude and phase of a signal change as the frequency changes. Bode plots are important in circuit simulation because they allow us to analyze the stability and performance of a circuit at different frequencies.

2. How do I create a Bode plot simulation using Simetrix?

To create a Bode plot simulation using Simetrix, you will need to first design your circuit using the schematic editor. Then, you can add a frequency sweep analysis block and specify the frequency range and number of points you want to simulate. Finally, run the simulation and the Bode plot will be automatically generated.

3. Can I customize the Bode plot in Simetrix?

Yes, Simetrix allows you to customize the Bode plot by adjusting the frequency range, number of points, and plot settings such as logarithmic or linear scale. You can also add markers, labels, and annotations to the plot for better analysis.

4. What are the benefits of using Simetrix for Bode plot simulation?

Simetrix offers a user-friendly interface and powerful simulation capabilities for Bode plot analysis. It also allows for easy integration with other simulation tools and supports a wide range of circuit components and models. Additionally, Simetrix provides accurate and reliable results for complex circuits.

5. Can I export the Bode plot data from Simetrix for further analysis?

Yes, Simetrix allows you to export the Bode plot data in various formats such as CSV, MATLAB, and Excel. This data can then be used for further analysis and visualization in other software tools.

Similar threads

  • Engineering and Comp Sci Homework Help
Replies
9
Views
2K
  • General Engineering
Replies
8
Views
313
  • Electrical Engineering
Replies
13
Views
2K
  • Engineering and Comp Sci Homework Help
Replies
3
Views
2K
  • Engineering and Comp Sci Homework Help
Replies
1
Views
1K
  • Engineering and Comp Sci Homework Help
Replies
1
Views
1K
  • Engineering and Comp Sci Homework Help
Replies
4
Views
1K
  • Engineering and Comp Sci Homework Help
Replies
9
Views
5K
  • Engineering and Comp Sci Homework Help
Replies
3
Views
1K
  • Engineering and Comp Sci Homework Help
Replies
5
Views
2K
Back
Top