- #1
hitachiin69
- 2
- 0
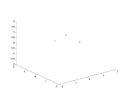
This might be an unusual thread but is that i really can't figure out how to plot single points in 3D space using MatLab.
I need to plot the points (1,0,0) , (0,1,0) and (0,0,1)
I need to plot the points (1,0,0) , (0,1,0) and (0,0,1)