Discussion Overview
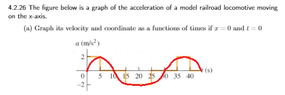
The discussion revolves around plotting a velocity graph over a given piece-wise linear acceleration graph. Participants are exploring how to represent these graphs using TikZ, a LaTeX package for creating graphics. The focus includes both the graphical representation and the mathematical integration required to derive the velocity from the acceleration.
Discussion Character
- Technical explanation
- Mathematical reasoning
- Exploratory
Main Points Raised
- Some participants express difficulty in understanding the task of plotting the velocity graph over the acceleration graph.
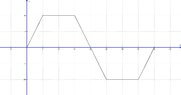
- There is a clarification that the red graph represents the velocity, which is to be plotted over the given yellow piece-wise linear acceleration graph.
- A participant provides a TikZ code snippet to illustrate how to create the acceleration graph and suggests that the velocity graph still needs to be added.
- One participant derives the velocity function from the acceleration function for the first segment of the graph, presenting the integration steps involved.
- Further integration is mentioned as necessary to find the velocity for later sections of the graph.
Areas of Agreement / Disagreement
Participants generally agree on the need to plot the velocity graph over the acceleration graph, but there is no consensus on the overall approach or the completeness of the graphs being discussed. The discussion remains exploratory with multiple contributions and no final resolution.
Contextual Notes
There are unresolved aspects regarding the integration for later sections of the graph and the overall accuracy of the plotted graphs. Participants have not reached a consensus on the final representation.