I will try to explain the convolution by analyzing it graphically. (you can see how convolution happen in this link
http://upload.wikimedia.org/wikipedia/commons/b/b9/Convolution_of_spiky_function_with_box2.gif)
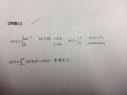
The convolution is $z(t)= \int \limits_{-\infty}^{\infty} y(\tau)x(t-\tau) \;d\tau$
now take
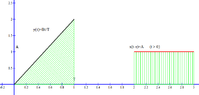
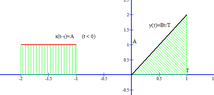
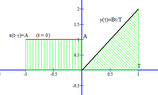
[math] y(\tau) = \frac{B\tau}{T} \quad 0\leq \tau \leq T[/math]
[math] x(\tau) = A \quad 0\leq \tau\leq T \implies x(t-\tau) = A \quad t-T\leq \tau \leq t[/math]
above two function are shown in the below graph (remember the variable of the integral is $\tau$)
View attachment 3428
Now we should see what happens to the integral ($z(t)$) when the value $t$ changes
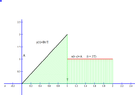
(i) when $t\leq 0$
As the graph below suggest there is no overlapping in the $x(t-\tau)$ and $y(\tau)$
View attachment 3429View attachment 3431
Therefore $\int_{-\infty}^\infty x(t-\tau)y(\tau)$ is 0. Thus when $t\leq 0 \implies z(t)=0$
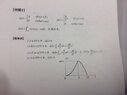
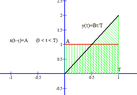
(ii) When $0<t\leq \tau$
View attachment 3427
View attachment 3433
As the graph shows the overlapping of two graphs starts at $\tau=0$ and ends at $\tau=t$.
Therefore the convolution at this scenario will be,
$z(t) = \int_0^t x(t-\tau)y(\tau) d\tau=\int_0^t A\frac{B}{T}\tau d\tau$
Thus, when $$0<t\leq T \implies z(t) = \int_0^t A\frac{B}{T}\tau d\tau$$
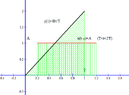
(iii) when $T<t\leq 2T$
View attachment 3434
View attachment 3432
As the graphs show the overlapping always end at $T$ and starts at $t-T$. Therefore the limits of the convolution in this scenario changes as following
$\int\limits_{t-T}^{T} x(t-\tau)y(\tau) \;d\tau = \int\limits_{t-T}^T A\frac{B}{T}\tau d\tau$
$$\therefore \text{when } T<t\leq 2T \implies z(t)=\int\limits_{t-T}^T A\frac{B}{T}\tau d\tau$$
(iv) when $t>2T$
View attachment 3430
On this occasion also the overlapping does not occur (similar to t<0). Therefore the convolution is zero.
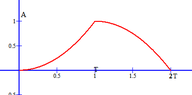
Thus $t>2T \implies z(t) =0$So eventually the piece-wise function of the z will be as following.
$$z(t)=\begin{cases}0 \quad t\leq 0 \\ A\frac{B}{2T}t^2 \quad 0<t\leq T \\ \frac{AB}{2T}(2tT-t^2)\quad T<t\leq 2T\\0 \quad t>2T \\ \end{cases}$$
View attachment 3436
Hope this will help to understand the convolution theory :)