mathmari
Gold Member
MHB
- 4,984
- 7
Hey! 
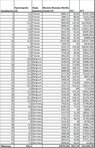
The below table shows the average monthly gross income of a sample of 44 developers. For each individual sample, it is indicated their country of employment and years of service in their field.
Calculate the regression line with the dependent variable the monthly gross income and independent the years of employee service and check the significance of the F criterion at $\alpha = 0.05$. I have done the following:
View attachment 9503
Therefore we get:
\begin{align*}\nu &=44 \\ \overline{X}&=\frac{\sum X}{\nu}=\frac{426.1}{44}=9.68 \\ \overline{Y}&=\frac{\sum Y}{\nu}=\frac{299767.60}{44}=6812.9 \\ \hat{\beta}&=\frac{\nu \sum \left (XY\right )-\left (\sum X\right )\left (\sum Y\right )}{\nu\sum X^2-\left (\sum X\right )^2}=\frac{44 \cdot 2911490.795-426.1\cdot 299767.60}{44\cdot 4417.39-426.1^2}=\frac{1.2810559498 \cdot 10^8-1.2773097436 \cdot 10^8}{194365.16-181561.21} \\ & =\frac{374620.62}{12803.95}=29.26 \\ \hat{\alpha}&=\overline{Y}-\hat{\beta}\cdot \overline{X}=6812.9-29.26\cdot 9.68=6812.9-283.2368=6529.66\end{align*}
So the regression line is \begin{equation*}\hat{Y}=29.26X+6529.66\end{equation*} We consider a F-test whether the slope is $0$ or not.
We have the formula $\displaystyle{F=\frac{MSM}{MSE}=\frac{\text{explained variance}}{\text{unexplained variance}}}$.
We have that $\displaystyle{MSM = \frac{SSM}{DFM}}$ with $\displaystyle{SSM=\sum_{i=1}^n\left (\hat{Y}_i-\overline{Y}\right )^2}$ and $\displaystyle{DFM = p - 1}$.
We also have that $\displaystyle{MSE = \frac{SSE}{DFE}}$ with $\displaystyle{SSE=\sum_{i=1}^n\left (Y_i-\hat{Y}_i\right )^2}$ and $\displaystyle{DFE = \nu-p}$. We have this table.
So we get
\begin{align*}&SSM=249138.5759 \\ &DFM=2-1=1 \\ &SSE=104926827.5 \\ &DFE=44-2=42 \\ &MSM=\frac{SSM}{DFM}=\frac{249138.5759}{1}=249138.5759 \\ &MSE=\frac{SSE}{DFE}=\frac{104926827.5}{42}=2498257.7976 \\ &F=\frac{MSM}{MSE}=\frac{249138.5759}{2498257.7976}=0.0997\end{align*}
Using at the R-program the command pf(0.0997, 1, 42, lower.tail=F) we get the p-value $0.7537537$.
That means that $\text{p-value} > \alpha$, does this mean that we accept the null hypothesis, i.e. that the slope is not significally different from $0$.
Is that correct? (Wondering)
The below table shows the average monthly gross income of a sample of 44 developers. For each individual sample, it is indicated their country of employment and years of service in their field.
Calculate the regression line with the dependent variable the monthly gross income and independent the years of employee service and check the significance of the F criterion at $\alpha = 0.05$. I have done the following:
View attachment 9503
Therefore we get:
\begin{align*}\nu &=44 \\ \overline{X}&=\frac{\sum X}{\nu}=\frac{426.1}{44}=9.68 \\ \overline{Y}&=\frac{\sum Y}{\nu}=\frac{299767.60}{44}=6812.9 \\ \hat{\beta}&=\frac{\nu \sum \left (XY\right )-\left (\sum X\right )\left (\sum Y\right )}{\nu\sum X^2-\left (\sum X\right )^2}=\frac{44 \cdot 2911490.795-426.1\cdot 299767.60}{44\cdot 4417.39-426.1^2}=\frac{1.2810559498 \cdot 10^8-1.2773097436 \cdot 10^8}{194365.16-181561.21} \\ & =\frac{374620.62}{12803.95}=29.26 \\ \hat{\alpha}&=\overline{Y}-\hat{\beta}\cdot \overline{X}=6812.9-29.26\cdot 9.68=6812.9-283.2368=6529.66\end{align*}
So the regression line is \begin{equation*}\hat{Y}=29.26X+6529.66\end{equation*} We consider a F-test whether the slope is $0$ or not.
We have the formula $\displaystyle{F=\frac{MSM}{MSE}=\frac{\text{explained variance}}{\text{unexplained variance}}}$.
We have that $\displaystyle{MSM = \frac{SSM}{DFM}}$ with $\displaystyle{SSM=\sum_{i=1}^n\left (\hat{Y}_i-\overline{Y}\right )^2}$ and $\displaystyle{DFM = p - 1}$.
We also have that $\displaystyle{MSE = \frac{SSE}{DFE}}$ with $\displaystyle{SSE=\sum_{i=1}^n\left (Y_i-\hat{Y}_i\right )^2}$ and $\displaystyle{DFE = \nu-p}$. We have this table.
So we get
\begin{align*}&SSM=249138.5759 \\ &DFM=2-1=1 \\ &SSE=104926827.5 \\ &DFE=44-2=42 \\ &MSM=\frac{SSM}{DFM}=\frac{249138.5759}{1}=249138.5759 \\ &MSE=\frac{SSE}{DFE}=\frac{104926827.5}{42}=2498257.7976 \\ &F=\frac{MSM}{MSE}=\frac{249138.5759}{2498257.7976}=0.0997\end{align*}
Using at the R-program the command pf(0.0997, 1, 42, lower.tail=F) we get the p-value $0.7537537$.
That means that $\text{p-value} > \alpha$, does this mean that we accept the null hypothesis, i.e. that the slope is not significally different from $0$.
Is that correct? (Wondering)
Attachments