mathmari
Gold Member
MHB
- 4,984
- 7
Hey! 
In a study at $15$ children at the age of $10$ years the number of hours of television watching per week and the pounds above or below the ideal body weight were determined (high positive values = overweight).
In a study at $15$ children at the age of $10$ years the number of hours of television watching per week and the pounds above or below the ideal body weight were determined (high positive values = overweight).
- Determine the simple linear regression equation by considering the weights above the ideal body weight as a dependent variable.
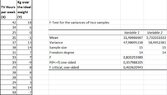
- Perform a significance test for the slope of the regression line at significance level $\alpha = 5\%$ (using p-values).
- Perform a significance test of the criterion F at significance level $\alpha = 0.05$ (using p-values).
- Determine the confidence interval for the average weight in pounds for a child who watches television for $36$ hours a week and for a child who watches television for $30$ hours a week. Which confidence interval is greater and why?
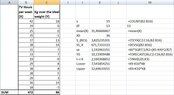
- At the beginning I calculated the following:
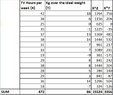
View attachment 9480
Using these information we get:
\begin{align*}&\nu =15 \\ &\overline{X}=\frac{\sum X}{\nu}=\frac{472}{15}=31.47 \\ &\overline{Y}=\frac{\sum Y}{\nu}=\frac{86}{15}=5.73 \\ &\hat{\beta}=\frac{\nu \sum \left (XY\right )-\left (\sum X\right )\left (\sum Y\right )}{\nu\sum X^2-\left (\sum X\right )^2}=\frac{15 \cdot 3356-472\cdot 86}{15\cdot 15524-472^2}=\frac{50340-40592}{232860-222784}=\frac{9748}{10076}=0.97 \\ & \hat{\alpha}=\overline{Y}-\hat{\beta}\cdot \overline{X}=5.73-0.97\cdot 31.47=5.73-30.5259=-24.80\end{align*}
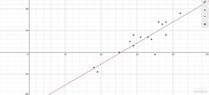
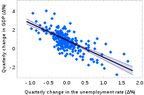
Therefore the linear regression equation with dependent variable the kg over the ideal weights is: \begin{equation*}\hat{Y}=0.97X-24.80\end{equation*}
The graph looks as follows:
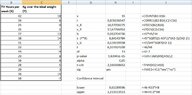
View attachment 9482 - We want to test the null hypothesis that the slope of the regression line is $0$.
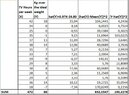
I found some notes and according to these I did the following:
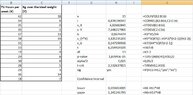
View attachment 9481 Since p-value < α (or |t| > t-crit) we reject the null hypothesis, and so we can’t conclude that the population slope is zero.
Is this correct? (Wondering)
But, according to these calculations we get an other slope than I got in the first question, or not? Here we have $b=0,91$ and in the first question I got $\hat{\beta}=0,97$.
So have I done something wrong at the calculation of the linear regression equation? (Wondering)