Discussion Overview
The discussion revolves around the graphing of 3D parametric equations, specifically the equations x=t, y=t^2, and z=2, using the Nspire calculator. Participants explore the nature of the resulting graph and its dimensional characteristics.
Discussion Character
- Exploratory
- Technical explanation
- Conceptual clarification
- Debate/contested
Main Points Raised
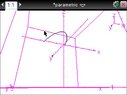
- One participant questions whether the graph produced from the parametric equations is correct and expresses surprise at its appearance.
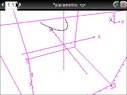
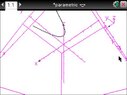
- Another participant confirms that the graph represents the equation $y=x^2$ on a plane parallel to the $xy$-plane, positioned 2 units above it.
- Some participants express confusion about the expected complexity of a 3D graph, suggesting it should have more depth or a hollow structure.
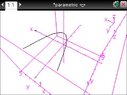
- There is a discussion about whether the graph should be considered a flat 3D surface, with one participant questioning the relationship between the variables.
- A later reply clarifies the relationship between the variables, asserting that given $x=t$ and $y=t^2$, it follows that $y=x^2$.
- Another participant provides a hint regarding the dimensionality of the graph, indicating that one independent variable results in a curve, while two independent variables yield a surface.
Areas of Agreement / Disagreement
Participants express differing views on the nature of the graph, with some agreeing on the correctness of the representation while others question its dimensionality and expected characteristics. The discussion remains unresolved regarding the expectations of 3D graphs.
Contextual Notes
Participants have not fully resolved the assumptions about the dimensionality of the graph and the implications of the parametric equations. There is also ambiguity regarding the interpretation of the graph's features.
 "is is" ) is the graph supposed to look like that? on a 3d plane? did i do it right?