GreenGoblin
- 68
- 0
hi,
i need to know how to plot the change of variables
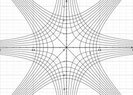
am i just to take x, and y as different constants, and treat it as normally on the (u,v) axis? so for the first, it will be like plotting on the (x,y) axis something like y^2 = x^2 - c, for different c, how many lines would i need to plot? and how would i mark it? would i say what c is each time
just to be sure these are the right lines, they are curvy like a hourglass, and they meet the axis at sqrt(c) on each side, so for each c we get two of these curves, so i need to plot all this twice. and then, also for the y=2uv, do i also plot this many times (for the same c) would i need to put all this lines on to the same plot? and mark each time which is c?
OR DO I NEED TO SHOW JUST WHERE X AND Y ARE BOTH CONSTANT? the wording has ambiguity.
i need to know how to plot the change of variables
am i just to take x, and y as different constants, and treat it as normally on the (u,v) axis? so for the first, it will be like plotting on the (x,y) axis something like y^2 = x^2 - c, for different c, how many lines would i need to plot? and how would i mark it? would i say what c is each time
just to be sure these are the right lines, they are curvy like a hourglass, and they meet the axis at sqrt(c) on each side, so for each c we get two of these curves, so i need to plot all this twice. and then, also for the y=2uv, do i also plot this many times (for the same c) would i need to put all this lines on to the same plot? and mark each time which is c?
OR DO I NEED TO SHOW JUST WHERE X AND Y ARE BOTH CONSTANT? the wording has ambiguity.