How to find if there are outliers, given mean, median, etc

  • Context: MHB 
  • Thread starter Thread starter chriskeller1
  • Start date Start date
  • Tags Tags
    Mean Median
Click For Summary
SUMMARY

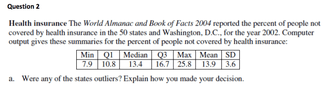
This discussion focuses on identifying outliers using statistical measures without the aid of a histogram. The conventional definition of an outlier is established as any data point lying beyond 1.5 times the Interquartile Range (IQR) from the first or third quartiles. In this case, with an IQR of 5.9, values below 1.95 or above 25.55 are classified as outliers. The maximum value of 25.8 indicates the presence of mild upper outliers in the dataset.

PREREQUISITES
  • Understanding of boxplots and their components
  • Knowledge of Interquartile Range (IQR)
  • Familiarity with quartiles and their calculation
  • Basic statistical concepts related to outlier detection
NEXT STEPS
  • Study the construction and interpretation of boxplots
  • Learn how to calculate the Interquartile Range (IQR) in datasets
  • Explore advanced outlier detection methods, such as Z-scores
  • Research the implications of outliers on statistical analysis and data interpretation
USEFUL FOR

Students preparing for statistics exams, data analysts, and anyone interested in understanding outlier detection methods in datasets.

chriskeller1
Messages
6
Reaction score
0
Hi guys, I'm getting ready for a stats exam and one of the questions looks like this
View attachment 3406
If I'm not given a histogram, how can this be solved?
 

Attachments

  • Screen Shot 2014-10-15 at 6.59.56 PM.png
    Screen Shot 2014-10-15 at 6.59.56 PM.png
    19.7 KB · Views: 129
Physics news on Phys.org
I think a boxplot can be useful here. Have you tried to draw the boxplot?
 
chriskeller1 said:
Hi guys, I'm getting ready for a stats exam and one of the questions looks like this
https://www.physicsforums.com/attachments/3406
If I'm not given a histogram, how can this be solved?

You do not need to do a box plot but you can adopt the conventional definition of outlier that corresponds to the whiskers of a box and whiskers plot. Then your definition of an outlier is any datum that lies beyond 1.5 times IQR of the 1st or 3rd quartiles.

Now the IQR=16.7-10.8=5.9, any datum that is less than 10.8-1.5 IQR= 1.95 or larger than 16.7 + 1.5 IQR = 25.55 is an outlier. Since the maximum is 25.8 there must be (mild) upper outliers.

.
 

Similar threads

  • · Replies 2 ·
Replies
2
Views
1K
  • · Replies 4 ·
Replies
4
Views
22K
  • · Replies 6 ·
Replies
6
Views
2K
  • · Replies 1 ·
Replies
1
Views
2K
  • · Replies 5 ·
Replies
5
Views
25K
  • · Replies 3 ·
Replies
3
Views
2K
  • · Replies 7 ·
Replies
7
Views
3K
  • · Replies 3 ·
Replies
3
Views
2K
Replies
4
Views
5K
  • · Replies 2 ·
Replies
2
Views
2K