Lambda96
- 233
- 77
- TL;DR
- Mathematica does not solve the differential equations
Hi,
unfortunately, I have problems that Mathematica does not solve the differential equation. The task is as follows and it is about the task c
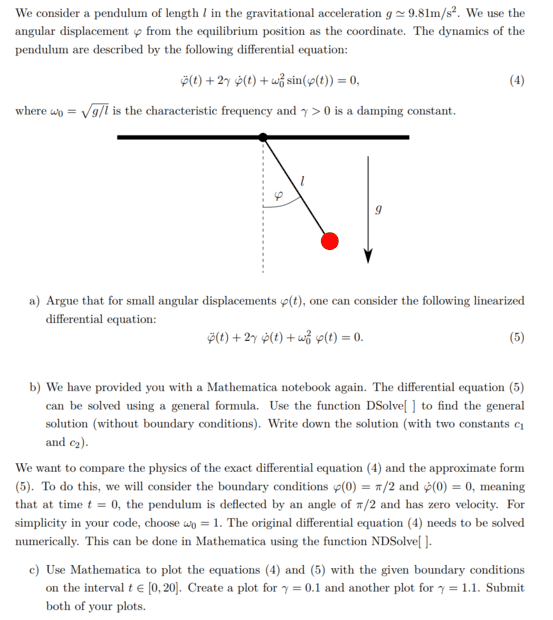
In the Mathematica Notebook, the following was written for task c
"You can use the following two lines of code to produce the solutions of the exact and approximated differential equations with boundary conditions. After that, write a plot[ ] function to sketch the two together."
exact[t_] := Evaluate[phi[t] /. NDSolve[..., phi[t], {t, 0, 20}]];
approx[t_] := Evaluate[phi[t] /. DSolve[..., phi[t], t]];I then tried to calculate the differential equation for equation (4) using the two codes and got the following

I then tried solving the differential equation using only NDSolve and get the following.

I am a beginner in Mathematica, so I do not know what I have done wrong in the two formulas?
unfortunately, I have problems that Mathematica does not solve the differential equation. The task is as follows and it is about the task c
In the Mathematica Notebook, the following was written for task c
"You can use the following two lines of code to produce the solutions of the exact and approximated differential equations with boundary conditions. After that, write a plot[ ] function to sketch the two together."
exact[t_] := Evaluate[phi[t] /. NDSolve[..., phi[t], {t, 0, 20}]];
approx[t_] := Evaluate[phi[t] /. DSolve[..., phi[t], t]];I then tried to calculate the differential equation for equation (4) using the two codes and got the following
I then tried solving the differential equation using only NDSolve and get the following.
I am a beginner in Mathematica, so I do not know what I have done wrong in the two formulas?
