TikZ graph of e^{(x^2-1)^2} -2

  • Context:
  • Thread starter Thread starter karush
  • Start date Start date
  • Tags Tags
    Graph

Tikz should render on PF

  • yes

    Votes: 0 0.0%
  • no

    Votes: 0 0.0%

  • Total voters
    0
Join the discussion
Ask a follow-up here, or get your own question answered by working scientists, mathematicians and engineers — people, not an autocomplete.
Real named experts · corrections over time · the nuance an AI answer skips
11 replies · 3K views
karush
Gold Member
MHB
Messages
3,240
Reaction score
5
ok I tried to tikz graph of e^{x^2-1)^2 -2 just borrowed an example online but this isn't what I want
the domain and range should be equal and want the normal xy axis not a box with tics only at the zeros

$$\begin{axis}
\addplot[
draw = blue,
domain=-2:2,
range=-2:2,
samples=50
] {exp(x^2-1)^2};
\end{axis}
\end{tikzpicture}$$

sorry thot it would render here?
 
Physics news on Phys.org
The picture should begin a begin tikzpicture marker.
And dollars should not be used around the picture. It is not a math formula after all.

Since we want to use the package pgfplots, we need load it in the preamble with a [M]%preamble[/M] directive.
You can see examples in the Live TikZ Editor, which you can activate from the MHB Widgets visible at the right when posting.

The result is:
[latexs]\begin{tikzpicture}
%preamble \usepackage{pgfplots}
\begin{axis}
\addplot[
draw = blue,
domain=-2:2,
range=-2:2,
samples=50
] {exp(x^2-1)^2};
\end{axis}
\end{tikzpicture}[/latexs]
\begin{tikzpicture}
%preamble \usepackage{pgfplots}
\begin{axis}
\addplot[
draw = blue,
domain=-2:2,
range=-2:2,
samples=50
] {exp(x^2-1)^2};
\end{axis}
\end{tikzpicture}

Use [M]ymax[/M] to set the range of the y-axis as a property of the [M]axis[/M].
Use [M]axis lines=middle[/M] to get normal axis lines.
And while we're at it, let's add [M]grid=both[/M] for some nice grid lines. ;)

[latexs]\begin{tikzpicture}
%preamble \usepackage{pgfplots}
\begin{axis}[ymax=6, axis lines=middle, grid=both]
\addplot[
draw = blue,
domain=-2:2,
range=-2:2,
samples=50
] {exp(x^2-1)^2};
\end{axis}
\end{tikzpicture}[/latexs]
\begin{tikzpicture}
%preamble \usepackage{pgfplots}
\begin{axis}[ymax=6, axis lines=middle, grid=both]
\addplot[
draw = blue,
domain=-2:2,
range=-2:2,
samples=50
] {exp(x^2-1)^2};
\end{axis}
\end{tikzpicture}

If you want, you can also add [M]xmin[/M] and [M]xmax[/M] to control the range of the x-axis.

Oh, and it looks as if you actual want a different formula than [M]exp(x^2-1)^2[/M].
Ah well, we can replace it with [M](exp(x^2-1))^2 - 2[/M] or [M]exp((x^2-1)^2) - 2[/M] depending on which one you wanted. (Thinking)
 
Re: tikx graph of e^{x^2-1)^2 -2

?

[DESMOS]advanced: {"version":7,"graph":{"squareAxes":false,"viewport":{"xmin":-2.5,"ymin":-2.5,"xmax":2.5,"ymax":2.5}},"expressions":{"list":[{"type":"expression","id":"graph1","color":"#2d70b3","latex":"y=e^{\\left(x^2-1\\right)^2}-2"},{"type":"expression","id":"2","color":"#388c46"}]}}[/DESMOS]
 
actually the desmos graph is the one I would like to duplicate in tikx
guess it is just changing the range limits

xmax and xmin for range ?
 
Last edited:
karush said:
actually the desmos graph is the one I would like to duplicate in tikx
guess it is just changing the range limits

xmax and xmin for range ?

If we use the formula [M]exp((x^2-1)^2)-2[/M], then TikZ complains that the values become to large.
We can fix it by reducing the [M]domain[/M] to, say, [M]-1.5:1.5[/M].
Then we don't need [M]ymax[/M] either.

[latexs]\begin{tikzpicture}
%preamble \usepackage{pgfplots}
\begin{axis}[axis lines=middle, grid=both]
\addplot[
draw = blue,
domain=-1.5:1.5,
range=-2:2,
samples=50
] {exp((x^2-1)^2)-2};
\end{axis}
\end{tikzpicture}[/latexs]
\begin{tikzpicture}
%preamble \usepackage{pgfplots}
\begin{axis}[axis lines=middle, grid=both]
\addplot[
draw = blue,
domain=-1.5:1.5,
range=-2:2,
samples=50
] {exp((x^2-1)^2)-2};
\end{axis}
\end{tikzpicture}
 
one more question if I may

how do you make the x tics and text only at the zeros
rather than equal distance apart
also the y tics are not needed

kinda new at this so...
 
karush said:
one more question if I may

how do you make the x tics and text only at the zeros
rather than equal distance apart
also the y tics are not needed

kinda new at this so...

You mean something like this?
\begin{tikzpicture}
%preamble \usepackage{pgfplots}
\begin{axis}[xmin=-1.8, xmax=1.8, axis lines=middle, ticks=none]
\addplot[
draw = blue,
domain=-1.5:1.5,
range=-2:2,
samples=50
] {exp((x^2-1)^2)-2}
foreach \x [evaluate={\xval=\x}] in {
{-sqrt(1+sqrt(ln(2)))}, {-sqrt(1-sqrt(ln(2)))}, {sqrt(1-sqrt(ln(2)))}, {sqrt(1+sqrt(ln(2)))}
} { (axis cs:{\xval},0) node[below] {\xval} };
\end{axis}
\end{tikzpicture}
 
Yep

Was that just off a node?

Assume the numbers were calculated outside of tikx
 
karush said:
Yep

Was that just off a node?

Assume the numbers were calculated outside of tikx

It's possible to let TikZ do all of the work as explained here.

I let TikZ do only part of the work though. That is, I found that the zeroes are $\pm\sqrt{1\pm\sqrt{\ln 2}}$ and I left the evaluation to TikZ.
Click on the picture to see the code.
 
well that is a very handy thing to know I see lots of uses for that

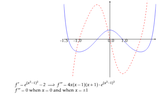
I tried to add the second derivative graph also on this graph
but it returned operater unknow but I tried exp also and :confused:
$f'' = 4x(x-1)(x+1) \cdot e^{(x^2-1)^2}$the problem is about where it is concave so need f''

so did this but gave it a c-
View attachment 9582

not sure why the tikx code didn't render here so this is an image form overleaf


$f'=e^{(x^2-1)^2}-2 \implies f'' = 4x(x-1)(x+1) \cdot e^{(x^2-1)^2}$
$f''=0$ when $x=0$ and when $x=\pm 1$
 

Attachments

  • Capture.PNG
    Capture.PNG
    4 KB · Views: 188
Last edited:
karush said:
well that is a very handy thing to know I see lots of uses for that

I tried to add the second derivative graph also on this graph
but it returned operater unknow but I tried exp also and :confused:
$f'' = 4x(x-1)(x+1) \cdot e^{(x^2-1)^2}$the problem is about where it is concave so need f''

so did this but gave it a c-not sure why the tikx code didn't render here so this is an image form overleaf


$f'=e^{(x^2-1)^2}-2 \implies f'' = 4x(x-1)(x+1) \cdot e^{(x^2-1)^2}$
$f''=0$ when $x=0$ and when $x=\pm 1$

That is actually the first derivative of $f$.
That is, it is $f'$.

Anyway, it works for me:
\begin{tikzpicture}
%preamble \usepackage{pgfplots}
\begin{axis}[xmin=-1.8, xmax=1.8, ymin=-3, ymax=3, axis lines=middle, ticks=none]
\addplot[
draw = blue, smooth, ultra thick,
domain=-1.5:1.5,
] {exp((x^2-1)^2)-2};
\addplot[
draw=red, smooth, ultra thick, dashed,
domain=-1.5:1.5,
smooth
] {4*x*(x-1)*(x+1)*exp((x^2-1)^2)}
foreach \x in {-1,0,1} { (axis cs:{\x},0) node[below right] {\x} };
\end{axis}
\end{tikzpicture}
 
total awsome...