tomtomtom1
- 160
- 8
Hi all
I was hoping someone could shed some light on the following:-
I am trying to understand what Yield strength is and understand the exact limit of where elastic and plastic deformation occurs on a stress strain curve.
Correct me if I am wrong but I define:-
Yield strength as the amount of stress a material can undergo before it deforms plastically.
Yield Point is the point on the stress strain graph where Elastic deformation ends and Plastic deformation begins.
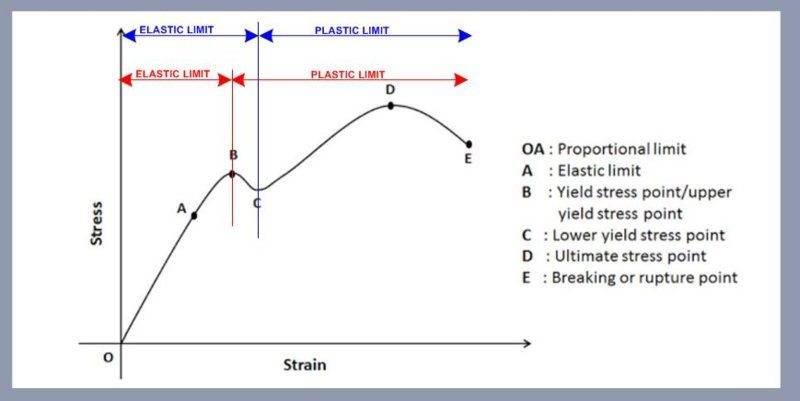
Would you agree with the above definitions, the reason why I ask is because on a stress strain curve (as shown below), we have 2 x Yield Stress Points shown as B and C.
1) what is the difference between these points.
2) where would the elastic and plastic limits commence from, the limits in Red or the limits in Blue?
I was hoping someone could shed some light on the following:-
I am trying to understand what Yield strength is and understand the exact limit of where elastic and plastic deformation occurs on a stress strain curve.
Correct me if I am wrong but I define:-
Yield strength as the amount of stress a material can undergo before it deforms plastically.
Yield Point is the point on the stress strain graph where Elastic deformation ends and Plastic deformation begins.
Would you agree with the above definitions, the reason why I ask is because on a stress strain curve (as shown below), we have 2 x Yield Stress Points shown as B and C.
1) what is the difference between these points.
2) where would the elastic and plastic limits commence from, the limits in Red or the limits in Blue?

