nycmathguy
Summary:: Graphs and Limits
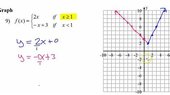
Use the graph to determine the limit of the piecewise function as x tends to 1.
Let me see.
lim of (-x + 3) as x-->1 from the left is 2.
lim of (2x) as x-->1 from the right is 2.
I can safely say that the limit of f(x) as x tends to 1 from the left and right simultaneously is 1.
The limit of f(x) is 1.
Correct?