What independence test should I use for this group of data? <-----------

In summary, the data seems to suggest a relationship between crime rates and unemployment rates. The line of least squares appears to be a good way to determine this relationship.
  • #1
hapx
1
0
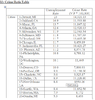
Hey Guys! I am working on a math project and I am stumped. I'm not sure weather I should use the chi-squared test or another test with my set of data. I am testing weather there is a relationship between crime rates and the unemployment rate of cities. Could someone please help? I'm not testing for the "r" correlation coefficient, but for the independence. I've attached my data. View attachment 3781 .
Please help me, I would really appreciate it! :-)
 

Attachments

  • crime ratio.PNG
    crime ratio.PNG
    16.4 KB · Views: 49
Last edited:
Physics news on Phys.org
  • #2
Welcome on MHB hapx!...

we introduce a simple algorithm that will be very useful in the examination of the data collected. Suppose we have n + 1 data formed in n + 1 points $x_{k},\ k = 0,1, ..., n$. Typically this is the situation that occurs when trying to characterize a phenomenon 'experimental'.Suppose we want to approximate the function 'unknown' y (x) for which we know in n + 1 samples detected 'experimentally' [therefore subjectto 'experimental errors' ...] with a polynomial of degree m with m<n so that it is …$\displaystyle y(x) \sim a_{0} + a_{1}\ x + a_{2}\ x^{2} + … + a_{m}\ x^{m} =p(x)\ (1)$ An approach known as the 'method of least squares' evaluates the coefficients $a_{i},\ i = 0,1, ..., m$ imposing to be minimum the quantity …$\displaystyle S= \sum_{k=0}^{n} [y_{k} – p(x_{k})]^{2}\ (2)$A case particularly 'simple' to deal is when the 'polynomial least squares' p (x) has degree m = 1, that is a straight line which iscalled 'line of least squares'. Since it is $p(x) = a_{0} + a{1}\ ⋅x$, is to determine only two unknowns: $a_{0}$ and $a_{1}$.With the usual techniques of the analysis is that the values of the two unknowns that minimize the expression (2) are ... $\displaystyle a_{0}= \frac{s_{2}\ t_{0} – s_{1}\ t_{1}}{s_{0}\ s_{2} –s_{1}^{2}}$ $\displaystyle a_{1}= \frac{s_{0}\ t_{1} – s_{1}\ t_{0}}{s_{0}\ s_{2} –s_{1}^{2}}\ (3)$being...$\displaystyle s_{i}= \sum_{k=0}^{n} (x_{k})^{i}$$\displaystyle t_{i}= \sum_{k=0}^{n} y_{k}\ (x_{k})^{i},\ i=0,1,2\ (4)$

In Your case is n = 19, so You have all the data You need ... once You have calculated the line of least squares to plot everything you can in the manner shown in the picture ...

i99363989._szw1280h1280_.jpg
In this case, the linear relationship between the data appears to be very good ...

Kind regards

$\chi$ $\sigma$
 

Related to What independence test should I use for this group of data? <-----------

What is an independence test?

An independence test is a statistical analysis used to determine whether two variables are related or not. It helps to determine if there is a significant association between the variables or if they occur independently of each other.

Why is it important to choose the right independence test for my data?

Choosing the right independence test is important because using the wrong test can lead to incorrect conclusions. Each test is designed for a specific type of data and using the appropriate test will ensure accurate results.

How do I know which independence test to use?

The independence test you should use depends on the type of data you have and the research question you are trying to answer. Some common tests include chi-square, Fisher's exact test, and McNemar's test. Consulting with a statistician or reviewing literature on similar studies can also help determine the appropriate test.

Can I use any independence test for any type of data?

No, different types of data require different independence tests. For example, chi-square tests are used for categorical data, while correlation tests are used for continuous data. It is important to choose a test that is appropriate for your specific type of data.

What are the assumptions for independence tests?

The assumptions for independence tests vary depending on the specific test being used. Some common assumptions include a large enough sample size, independent observations, and normally distributed data. It is important to check the assumptions of the chosen test before conducting the analysis.

Similar threads

  • Set Theory, Logic, Probability, Statistics
Replies
6
Views
828
  • Set Theory, Logic, Probability, Statistics
Replies
1
Views
634
  • Set Theory, Logic, Probability, Statistics
Replies
1
Views
823
  • Set Theory, Logic, Probability, Statistics
Replies
1
Views
1K
  • Set Theory, Logic, Probability, Statistics
Replies
7
Views
2K
  • Set Theory, Logic, Probability, Statistics
Replies
8
Views
1K
  • Set Theory, Logic, Probability, Statistics
Replies
1
Views
1K
  • Set Theory, Logic, Probability, Statistics
Replies
23
Views
2K
  • Set Theory, Logic, Probability, Statistics
Replies
1
Views
972
  • Set Theory, Logic, Probability, Statistics
Replies
6
Views
4K
Back
Top