Drawing Elliptic Abacus with pgfplots and tikz

  • Context: MHB 
  • Thread starter Thread starter yakoum
  • Start date Start date
  • Tags Tags
    Drawing
Click For Summary

Discussion Overview

The discussion revolves around how to draw an elliptic abacus using pgfplots and TikZ, particularly in the context of statistics and binomial confidence intervals. Participants seek clarification on the specific functions and parameters needed for the graph.

Discussion Character

  • Exploratory, Technical explanation, Conceptual clarification

Main Points Raised

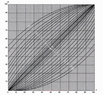
  • One participant requests assistance in identifying the function necessary to draw an elliptic abacus in statistics using pgfplots and TikZ.
  • Another participant asks for clarification on whether the inquiry pertains to creating a TikZ plot in general, a specific type of plot, or a particular set of functions.
  • A participant mentions that the context involves calculating confidence intervals for a binomial distribution under certain conditions (nf<20 and n(1-f)<20), but expresses uncertainty about the graph's representation.
  • One participant provides a formula for the confidence interval of a binomial distribution, noting the potential ambiguity regarding the variables involved (specifically the meaning of 'p' and 'f').
  • There is a request for additional information regarding the axes and their intended representation in the graph.

Areas of Agreement / Disagreement

The discussion remains unresolved, with multiple competing views and uncertainties regarding the specific functions and representations needed for the graph.

Contextual Notes

Participants express limitations in understanding the graph's requirements and the definitions of the variables involved, which may affect their ability to provide accurate assistance.

yakoum
Messages
2
Reaction score
0
Could you help me please
With which function can we draw elliptic abacus in Statistic?
I want to draw this function with pgfplots, tikz
thank you
View attachment 4466
 

Attachments

  • abaque - Copie.PNG
    abaque - Copie.PNG
    24.1 KB · Views: 112
Last edited:
Mathematics news on Phys.org
yakoum said:
Could you help me please
With which function can we draw elliptic abacus in Statistic?
I want to draw this function with pgfplots, tikz
thank you

Hi yakoum! Welcome to MHB! (Smile)

Can you clarify what you're asking for?

Is it about how to create a tikz plot at all?
Or a tikz plot with axes like that?
Or is it about a specific set of functions? If so, which ones?
 
I want to know with which function we can draw this graph(I don't know the function).
in Statistic, it concern binomial when we calculate confidence interval when nf<20 and n(1-f) <20
Is it clear?
 
Last edited:
yakoum said:
I want to know with which function we can draw this graph(I don't know the function).
in Statistic, it concern binomial when we calculate confidence interval when nf<20 and n(1-f) <20
Is it clear?

Well... the confidence interval for a binomial distribution would be $np \pm \sqrt{np(1-p)}$, where $p$ is the probability of a success and $n$ is the number of trials.
But to be honest, I don't understand your graph yet. You have a $p$ there, which might be the probability of a success, but it could also be the p-value related to the confidence interval. The $f$ axis might be one or the other - I can't tell.
Either way, if I plot it myself, with some assumptions, I get graphs that are somewhat similar, but not the same.

Can you provide some more information?
What are the axes supposed to represent?
 

Similar threads

  • · Replies 2 ·
Replies
2
Views
1K
Replies
2
Views
2K
  • · Replies 3 ·
Replies
3
Views
2K
  • · Replies 1 ·
Replies
1
Views
8K
  • · Replies 2 ·
Replies
2
Views
3K
  • · Replies 1 ·
Replies
1
Views
3K
  • · Replies 1 ·
Replies
1
Views
2K
Replies
5
Views
3K
  • Poll Poll
  • · Replies 1 ·
Replies
1
Views
2K
  • · Replies 3 ·
Replies
3
Views
2K