ardentmed
- 158
- 0
Hey guys,
More questions for you guys this time, these seem easy but always have a few nuances I seem to miss. With that said, I'd greatly appreciate your guys' help.
Question:

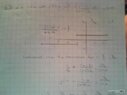
For 1a, I sketched two straight lines where x=/ 1 and y=1/2 for one line and y= -1/2 for the other.
Thus, x=1 is a vertical asymptote.
For 1b, f is not continuous because the limit at 1 from the left and right differ; one is 1/2 while the other is -1/2.
For 1c, the function is not differentiable at a=1 because a function f is differentiable at "a" if f ' (a) exists, meaning it must be differentiable over an open interval with "a" in it. a=1 is thus not part of the domain of f: (-infinity,1)u(1, infinity). Thus, f ' (1) is not possible.
As for 2a, I took the limit as x approaches infinity and used the limit division laws (I took the limit of both the nominator and the denominator accordingly)
Thus, $\lim_{{x}\to{infinity}}$ (1+ 2/x) / $\lim_{{x}\to{infinity}}$ √(9+ 5/(x^2)) =
1/√9
=1/3
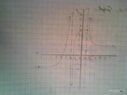
Also, 7b gave me the most bizarre graph I've seen in quite a while. Would anyone know what this should roughly look like? The one I sketched has 3 points of discontinuity, which I find disconcerting.
Thanks in advance.
More questions for you guys this time, these seem easy but always have a few nuances I seem to miss. With that said, I'd greatly appreciate your guys' help.
Question:
For 1a, I sketched two straight lines where x=/ 1 and y=1/2 for one line and y= -1/2 for the other.
Thus, x=1 is a vertical asymptote.
For 1b, f is not continuous because the limit at 1 from the left and right differ; one is 1/2 while the other is -1/2.
For 1c, the function is not differentiable at a=1 because a function f is differentiable at "a" if f ' (a) exists, meaning it must be differentiable over an open interval with "a" in it. a=1 is thus not part of the domain of f: (-infinity,1)u(1, infinity). Thus, f ' (1) is not possible.
As for 2a, I took the limit as x approaches infinity and used the limit division laws (I took the limit of both the nominator and the denominator accordingly)
Thus, $\lim_{{x}\to{infinity}}$ (1+ 2/x) / $\lim_{{x}\to{infinity}}$ √(9+ 5/(x^2)) =
1/√9
=1/3
Also, 7b gave me the most bizarre graph I've seen in quite a while. Would anyone know what this should roughly look like? The one I sketched has 3 points of discontinuity, which I find disconcerting.
Thanks in advance.