Graphing Distance vs. Time for a Commuting Student's Forgotten Term Paper

In summary: Delta d}{\Delta t}=\frac{0-d}{\frac{3}{2}t-t}=-\frac{d}{\frac{1}{2}t}=-2\frac{d}{t}The slope of the student's return trip will be -2/5 or -0.8.
  • #1
mathdad
1,283
1
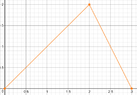
A student who commutes 27 miles to attend college remembers, after driving a few minutes, that a term paper that is due has been forgotten. Driving faster than usual, the student returns home, picks up the paper, and once again starts toward school. Sketch a possible graph of the student's distance from home as a function of time. What are the steps to answer this question?
 
Mathematics news on Phys.org
  • #2
What have you got so far?
 
  • #3
MarkFL said:
What have you got so far?

Mark,

I am on the 7 train in Queens, NYC heading back home to the Bronx. When I get home, I will post my understanding of this question, which will be wrong for sure. In fact, my work shown will not make sense and may cause some of you to ask: WHY DOESN'T THIS PRECALCULUS GUY UNDERSTAND WHAT TO DO AS A FIRST COUPLE OF STEPS?
 
  • #4
RTCNTC said:
WHY DOESN'T THIS PRECALCULUS GUY UNDERSTAND WHAT TO DO AS A FIRST COUPLE OF STEPS?

No such thoughts will (or should) ever be conceived by a good teacher (as are those members here!). Any of your thoughts and working help others in identifying your particular misunderstanding. And if that means making several posts, progressively stepping through the problem, so be it.
 
  • #5
Let the x-axis = time of travel in hours

Let the y-axis = miles traveled

I think we are talking about a straight line or linear function graph.

The question does not state the amount of minutes the student drove before realizing that he forgot his term paper nor does it mentions the length he drove.

On the graph, A is the time in minutes he drove and B the length. See picture. Is this correct?

View attachment 7868
 

Attachments

  • sDraw_2018-02-26_02-44-52.png
    sDraw_2018-02-26_02-44-52.png
    8.8 KB · Views: 68
  • #6
Looks good so far...now what's going to happen when the student heads back home at a faster speed?
 
  • #7
MarkFL said:
Looks good so far...now what's going to happen when the student heads back home at a faster speed?

The graph changes direction? Must I draw another arrow pointing downward?
 
  • #8
RTCNTC said:
The graph changes direction? Must I draw another arrow pointing downward?

Suppose the vertical axis is $d$ and the horizontal $t$, to represent distance and time, respectively. What does a point $(t,d)$ represent?
 
  • #9
MarkFL said:
Suppose the vertical axis is $d$ and the horizontal $t$, to represent distance and time, respectively. What does a point $(t,d)$ represent?

The point (t, d) represents the student's distance from home.
 
  • #10
RTCNTC said:
The point (t, d) represents the student's distance from home.

The vertical distance of the point above the $t$-axis represents this distance, while the horizontal distance of the point to the $d$-axis to its left represents the time.

When the student returns toward home, what should be happening to the coordinates of the points on the graph?
 
  • #11
MarkFL said:
The vertical distance of the point above the $t$-axis represents this distance, while the horizontal distance of the point to the $d$-axis to its left represents the time.

When the student returns toward home, what should be happening to the coordinates of the points on the graph?

The coordinates of the point (t, d) should be increasing or decreasing.
 
  • #12
RTCNTC said:
The coordinates of the point (t, d) should be increasing or decreasing.

As the student returns home, time is increasing (moving forward), but the distance from home is decreasing and so the slope of the graph will be negative. How will the magnitude of the slope compare to when the student was moving away from hom before turning back?
 
  • #13
MarkFL said:
As the student returns home, time is increasing (moving forward), but the distance from home is decreasing and so the slope of the graph will be negative. How will the magnitude of the slope compare to when the student was moving away from hom before turning back?

I do not understand? Magnitude of the slope?
 
  • #14
RTCNTC said:
I do not understand? Magnitude of the slope?

How steep will it be, in comparison to the first part of the trip?
 
  • #15
By "steep" you are talking about slope but I don't get it.

Origin = (0,0)

Our point is (t, d)

Can you steepness be found using these 2 points?

m = (t - 0)/(d - 0)

m = t/d

Does the value of m here satisfy the "steep" part of your question?
 
  • #16
RTCNTC said:
By "steep" you are talking about slope but I don't get it.

Origin = (0,0)

Our point is (t, d)

Can you steepness be found using these 2 points?

m = (t - 0)/(d - 0)

m = t/d

Does the value of m here satisfy the "steep" part of your question?

Excellent! Now, suppose the student travels back home twice as fast as he left...what will the slope of the second part of the trip be?
 
  • #17
The slope of the second part of his trip is 2(t/d).
 
  • #18
RTCNTC said:
The slope of the second part of his trip is 2(t/d).

Let's check:

\(\displaystyle m=\frac{\Delta d}{\Delta t}=\frac{0-d}{\frac{3}{2}t-t}=-\frac{d}{\frac{1}{2}t}=-2\frac{d}{t}\)

I didn't notice earlier that you mixed up $d$ and $t$.
 
  • #19
The answer is -2(d/t) not 2(d/t). Why a negative slope?
 
  • #20
RTCNTC said:
The answer is -2(d/t) not 2(d/t). Why a negative slope?

Shouldn't we expect a negative slope since the $d$ coordinate will be moving towards the $t$-axis from some positive value, towards where $d=0$?
 
  • #21
And so, the final answer to this question is?
 
  • #22

Attachments

  • rtc_dt.png
    rtc_dt.png
    4.5 KB · Views: 42
  • #23
MarkFL said:
It could look something like:

You are truly gifted. Thanks.
 

Related to Graphing Distance vs. Time for a Commuting Student's Forgotten Term Paper

What is "Distance As Function of Time"?

"Distance As Function of Time" is a mathematical concept that describes the relationship between distance and time for a moving object. It shows how the distance an object travels changes over a certain period of time.

How is "Distance As Function of Time" represented?

"Distance As Function of Time" is often represented graphically, with distance on the y-axis and time on the x-axis. The resulting graph is called a distance-time graph and can show the speed and direction of the object's motion.

What is the difference between distance and displacement?

Distance refers to the total length an object has traveled, regardless of direction. Displacement, on the other hand, is the straight-line distance between an object's starting and ending point, taking into account direction. Displacement is a vector quantity, while distance is a scalar quantity.

How does the slope of a distance-time graph relate to the object's speed?

The slope of a distance-time graph is equal to the object's speed. A steeper slope indicates a higher speed, while a flatter slope indicates a lower speed. A horizontal line on the graph indicates that the object is not moving, as the distance is not changing over time.

Can "Distance As Function of Time" be used to predict an object's future position?

Yes, by analyzing the distance-time graph and determining the slope, you can predict an object's future position. The steeper the slope, the greater the speed, and the further the object will travel in a given period of time. However, external factors such as changes in speed or direction can affect the accuracy of the prediction.

Similar threads

Replies
66
Views
4K
Replies
2
Views
2K
  • STEM Academic Advising
Replies
11
Views
1K
  • Introductory Physics Homework Help
Replies
2
Views
2K
  • STEM Career Guidance
Replies
4
Views
2K
  • Advanced Physics Homework Help
Replies
6
Views
1K
  • STEM Academic Advising
Replies
19
Views
2K
  • Introductory Physics Homework Help
Replies
1
Views
1K
  • STEM Academic Advising
Replies
5
Views
2K
  • General Discussion
Replies
4
Views
689
Back
Top