Graphing electric potential for two positive charges

Click For Summary
SUMMARY

This discussion focuses on graphing electric potential for two positive charges using the Desmos plotting tool. Users compare their graphs, specifically the y-axis labeled as ## V(\frac{k_eQ}{a}) ## and the x-axis as ## x(a) ##, against textbook examples. Key issues identified include improper labeling of the y-axis and the need for equally spaced tick marks. The conversation emphasizes the importance of using accurate plotting tools to ensure precise comparisons.

PREREQUISITES
  • Understanding of electric potential and its mathematical representation.
  • Familiarity with graphing tools, specifically Desmos.
  • Knowledge of dimensional analysis in physics.
  • Basic algebra and manipulation of equations.
NEXT STEPS
  • Learn how to use Desmos for plotting complex equations.
  • Study the principles of electric potential and its graphical representation.
  • Explore dimensional analysis in physics to understand variable relationships.
  • Investigate common mistakes in graphing and how to avoid them.
USEFUL FOR

Students and educators in physics, particularly those focusing on electromagnetism, as well as anyone interested in improving their graphing skills using digital tools like Desmos.

member 731016
Homework Statement
Please see below
Relevant Equations
Please see below
For part (a) of this problem,
1674594378095.png

The solution is
1674594413966.png

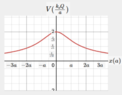
However, my solution is
1674594447007.png

Am I correct? In the solutions that don't appear to plot the electric potential as units of ## \frac {k_eQ} {a} ## like I have which the problem statement said to do.

Many thanks!
 
Physics news on Phys.org
Your plot is too crudely drawn for a direct comparison with the textbook. Not only that, but in your plot the tick marks on the vertical axis are not equally spaced as is the case in the textbook plot. So what exactly are you comparing? I suggest that you use a plotting program instead of doing it freehand. Free plotting programs exist on the internet. I went to https://www.desmos.com/calculator and created this.

Screen Shot 2023-01-24 at 3.21.43 PM.png
 
  • Like
Likes   Reactions: PhDeezNutz and member 731016
kuruman said:
Your plot is too crudely drawn for a direct comparison with the textbook. Not only that, but in your plot the tick marks on the vertical axis are not equally spaced as is the case in the textbook plot. So what exactly are you comparing? I suggest that you use a plotting program instead of doing it freehand. Free plotting programs exist on the internet. I went to https://www.desmos.com/calculator and created this.

View attachment 321043
Yes sorry @kuruman I will graph it. I am comparing my graph which has a y-axis of ## V(\frac{k_eQ}{a}) = \frac {2}{\sqrt{10}}, \frac {2}{\sqrt{5}}, \frac {2}{\sqrt{2}}, 2## and x-axis of## x(a) = -3a, -2a, -a, a, 2a, 3a ##
 
Last edited by a moderator:
kuruman said:
Your plot is too crudely drawn for a direct comparison with the textbook. Not only that, but in your plot the tick marks on the vertical axis are not equally spaced as is the case in the textbook plot. So what exactly are you comparing? I suggest that you use a plotting program instead of doing it freehand. Free plotting programs exist on the internet. I went to https://www.desmos.com/calculator and created this.

View attachment 321043
Here is my new graph @kuruman
1674598770227.png

I am comparing the y and x axes. I am not sure whether my graph is correct or not.

Thanks!
 

Attachments

  • 1674598616983.png
    1674598616983.png
    18.9 KB · Views: 132
It is not correct. The x-axis is fine and compares directly with the textbook and my plot if ##a=1##, i.e. plot ##k_eQ/ a## vs. ##x/a##. The y-axis is not OK. You cannot label equally spaced intervals using unequal labels. Since there are four intervals between zero and 2 on the vertical axis, the labels should be 0.5, 1.0 and 1.5. In fact the demos plotting utility assumes that this is the case.
 
  • Like
Likes   Reactions: member 731016
kuruman said:
It is not correct. The x-axis is fine and compares directly with the textbook and my plot if ##a=1##, i.e. plot ##k_eQ/ a## vs. ##x/a##. The y-axis is not OK. You cannot label equally spaced intervals using unequal labels. Since there are four intervals between zero and 2 on the vertical axis, the labels should be 0.5, 1.0 and 1.5. In fact the demos plotting utility assumes that this is the case.
Thank you for your reply @kuruman ! Whoops I see my mistake with the y-axis. Also, I've never seen the notation ##x/a## - what does it mean please?

I will post a new graph soon.
 
kuruman said:
It is not correct. The x-axis is fine and compares directly with the textbook and my plot if ##a=1##, i.e. plot ##k_eQ/ a## vs. ##x/a##. The y-axis is not OK. You cannot label equally spaced intervals using unequal labels. Since there are four intervals between zero and 2 on the vertical axis, the labels should be 0.5, 1.0 and 1.5. In fact the demos plotting utility assumes that this is the case.
Here's the new graph @kuruman ,
1674600472875.png
 
That's fine except for the old labels on the vertical axis that need to be removed. Just so that you know. You don't have to do it because it's not going to be graded.
 
  • Like
Likes   Reactions: member 731016
kuruman said:
That's fine except for the old labels on the vertical axis that need to be removed. Just so that you know. You don't have to do it because it's not going to be graded.
Thank you @kuruman , but I still don't see how my and their graphs are equivalent. On their graph the y-axis is ## \frac {V(x)a} {k_eQ}## and my graph it is ## V (\frac {k_eQ} {a}) ##

For the x-axis, their graph is ## x/a ## and my graph is ## x ##.

Correct me if I am wrong, but the notation ## x ## is the same as ## x(a) ##. I'm not sure why.

Many thanks!
 
  • #10
Callumnc1 said:
Thank you @kuruman , but I still don't see how my and their graphs are equivalent. On their graph the y-axis is ## \frac {V(x)a} {k_eQ}## and my graph it is ## V (\frac {k_eQ} {a}) ##

For the x-axis, their graph is ## x/a ## and my graph is ## x ##.

Correct me if I am wrong, but the notation ## x ## is the same as ## x(a) ##. I'm not sure why.

Many thanks!
EDIT: Sorry I meant that the notation ## x ## is not the same as ## x(a) ##
 
  • #11
This may help https://www.desmos.com/calculator/zu8hbssbxp . (Visit to see how the pieces below are created.)

Vary the a-slider.

(By the way, you can copy-paste equations from desmos (as TeX, acceptable for MathJax)... just surround by itex and /itex in square brackets .)

V_{factor}=\frac{2}{\sqrt{\left(x_{factor}\right)^{2}+1}} (right-click the equation)
where
V=\frac{kQ}{a}\left(\frac{2}{\sqrt{\left(\frac{x}{a}\right)^{2}+1}}\right)

V_{fac}=\frac{V}{\left(\frac{kQ}{a}\right)} and x_{fac}=\frac{x}{a} (different variable names given in Desmos) are both dimensionless quantities.
(\frac{kQ}{a} carries the units of Volts, and \frac{x}{a} carries the units of meters.)Note that if the [implied] right-hand-side of an entry has a free variable, it becomes the independent variable.

1674650831022.png
 
Last edited:
  • Like
Likes   Reactions: member 731016 and kuruman
  • #12
robphy said:
This may help https://www.desmos.com/calculator/zu8hbssbxp . (Visit to see how the pieces below are created.)

Vary the a-slider.

(By the way, you can copy-paste equations from desmos (as TeX, acceptable for MathJax)... just surround by itex and /itex in square brackets .)

V_{factor}=\frac{2}{\sqrt{\left(x_{factor}\right)^{2}+1}} (right-click the equation)
where
V=\frac{kQ}{a}\left(\frac{2}{\sqrt{\left(\frac{x}{a}\right)^{2}+1}}\right)

V_{fac}=\frac{V}{\left(\frac{kQ}{a}\right)} and x_{fac}=\frac{x}{a} (different variable names given in Desmos) are both dimensionless quantities.
(\frac{kQ}{a} carries the units of Volts, and \frac{x}{a} carries the units of meters.)Note that if the [implied] right-hand-side of an entry has a free variable, it becomes the independent variable.

View attachment 321094
Thank you for your reply @robphy ! I kind of get what you are saying that my and their graphs are equivalent, is that correct?

Many thanks!
 
  • #13
Type in your equation in that Desmos file and see if it matches.
 
  • Like
Likes   Reactions: member 731016
  • #14
robphy said:
Type in your equation in that Desmos file and see if it matches.
Thank you for your reply @robphy! How do I do that sorry?

Many thanks!
 
  • #15
On that Desmos file, add a blank entry or scroll down to find one blank entry.
Type in your formula, using variable names not already used.
 
  • Like
Likes   Reactions: member 731016
  • #16
robphy said:
On that Desmos file, add a blank entry or scroll down to find one blank entry.
Type in your formula, using variable names not already used.
Thank you @robphy! I will give it a try and post it.
 
  • #17
robphy said:
On that Desmos file, add a blank entry or scroll down to find one blank entry.
Type in your formula, using variable names not already used.
Thanks @robphy - it seems to be working! However why dose it work?

Many thanks!
 

Similar threads

  • · Replies 2 ·
Replies
2
Views
1K
Replies
4
Views
917
  • · Replies 11 ·
Replies
11
Views
1K
  • · Replies 22 ·
Replies
22
Views
4K
Replies
8
Views
2K
  • · Replies 10 ·
Replies
10
Views
2K
  • · Replies 6 ·
Replies
6
Views
2K
  • · Replies 5 ·
Replies
5
Views
1K
  • · Replies 2 ·
Replies
2
Views
2K
  • · Replies 4 ·
Replies
4
Views
905