@Leopold89 I have been watching the thread for a while and I think it's very interesting. I'm not nearly as experienced as
@Chestermiller but maybe the input can still be useful.
You mentioned you're mainly interested in knowing the mass remaining in the tank. Before diving into thermodynamic properties and equations, would it be possible just to weigh the loaded and unloaded tank? Or maybe knowing how much you put in and later weighing the discharged gas into a reservoir so you can know how much remains.
If it's not possible, let me first say that the information available is very limited. Knowing extensive properties (mass, internal energy [J], etc) from only intensive properties (pressure, density/specific volume, temperature, etc) is very hard. I'm not even sure is possible. You may be able to fully define the thermodynamic state of a substance but you don't know how much of it there is. At some point, some extensive information must be added.
In this scenario, only the pressure is known which we can assume is uniform within the tank. Even the temperature of the content isn't really measured since you said it's measured in the room ##(\tau)## and not in the tank ##(T)##. As you mentioned in point (2) in the OP, why isn't it possible to measure the temperature inside? I guess it could be derived from other equations but it makes everything a little more complex than it already is and more assumptions are necessary to be able to run the numbers. If you end up being able to install temperature sensors, I'd install a bunch of them at different locations (somewhere in the middle, the bottom, near the valves, etc.). I'd assume the temperature is uniform though just like the pressure although it depends on how rapid the process is. If it's very quick, the area near the valve will be different and, if there is a mixture of liquid and gas, they might not be in equilibrium where they would have the same pressure and temperature.
Assuming none of what I said before is possible, could you characterize the valve? That way, the output mass could be derived from the properties of the gasses.
(NOTE: For all my calculations I'll assume the properties to be uniform so pressure and temperature are the same for everything inside the tank although internal energy, enthalpy and so on will depend on whether it's liquid or gas. Basically, I'm assuming the content is going from A→B through equilibrium states.)
If the full content of the tank were a gas, the approximation to find the mass isn't too difficult depending on how much accuracy you want. Ideal gas law will give you a quick result since you already know the pressure, the temperature, and the total volume (this would be your extensive property) of the tank. As long as you check from the property tables that you don't have a saturated mixture you could use the simple ideal gas law (or use tabulated values).
$$PV = mRT \rightarrow m = \frac{PV}{RT}$$
So the problem lies in the saturated mixture of which we don't know the proportion of gas to liquid or "vapor quality" ##x##. I'll focus on modeling the problem for the time when that mixture is in the tank. As time goes on, more liquid will continue to evaporate until it's 100% gas and you switch to the model previously mentioned.
Using a control volume which is the tank, I'll apply the conservation of mass and conservation of energy.
CONSERVATION OF MASS
$$\frac{d}{dt}\int_{CV}\rho dV=\dot{m}_{in}-\dot{m}_{out}$$
In this problem, gas is only coming out of the tank so we can make ##\dot{m}_{in}=0##. Because of the sign convention used, ##\dot{m}_{out}## will be positive.
The integral on the left side can be evaluated as:
$$\int_{CV}\rho dV = m_{g}+m_{f}$$
Where ##m_g## is the mass of saturated gas in the mixture and ##m_f## is the mass of the saturated fluid.
The end result of the conservation of mass applied on the control volume is:
$$\frac{dm_{g}}{dt}+\frac{dm_{f}}{dt}=-\dot{m}_{out}$$
(I have intentionally not used the · sign for derivatives on the left side because, although it's mass changing over time, that's not really "flow".
The functions ##m_g(t)## and ##m_f(t)## are what we need. To calculate them, we need to know more about the output mass flow ##\dot{m}_{out}##. If you experimentally measure it, then that's it. Use that function. If you can't measure it but you can characterize the valve, then the mass flow should be possible to be expressed using the characteristics of the valve and the properties of the gas. If you can't characterize the valve, you'll have to solve the problem several times using different values for the characteristics of the valve and checking if the results are similar to the experimental values of ##P## and ##T## that you already have.
Anyway, we have two functions so we need two boundary conditions, which will be the initial masses of the system, and two equations. For the second equation, we use conservation of energy.
CONSERVATION OF ENERGY
$$\frac{dE_{CV}}{dt}=\dot{Q}-\dot{W}+\dot{m}_{in}h_{in}-\dot{m}_{out}h_{out}$$
From that equation, we know we're not introducing or extracting work in the system so ##\dot{W}=0##.
The heat input ##\dot{Q}## will be a function of the temperature difference and the thermal resistance. The temperature difference I assume is known from the room temperature which I consider constant and whatever function you're using to find out the temperature inside the tank from the value ##(\tau)##. You mentioned the thermal resistance in another post so it's known too.
The input flow we have already said it's ##\dot{m}_{in}=0##.
The output flow ##\dot{m}_{out}## is a function whose properties have already been discussed in the previous equation.
The enthalpy of the output ##h_{out}## flow is known since you know the temperature and pressure of the saturated mix at any moment so you can find it in tables (notice that it'll change as time passes).
Lastly, the energy in the control volume ##E_{CV}## will be only the internal energy of the gas and liquid because it's not flowing. It can be expressed as:
$$\frac{dE_{CV}}{dt}=\frac{dU_{g}}{dt}+\frac{dU_{l}}{dt}$$
Since it's a saturated mixture, it's going through a phase change. Therefore, its pressure and temperature should be constant.
$$\frac{dU_{g}}{dt}=\frac{d(cmT)_{g}}{dt}=c_g T_g \frac{dm_{g}}{dt}$$
$$\frac{dU_{l}}{dt}=\frac{d(cmT)_{l}}{dt}=c_l T_l \frac{dm_{l}}{dt}$$
As a result, the expression for the conservation of energy during the discharge of the saturated mixture is:
$$c_g T_g \frac{dm_{g}}{dt}+c_l T_l \frac{dm_{l}}{dt}=\dot{Q}-\dot{m}_{out}h_{out}$$
That system of differential equations should be solvable from the information I described. For greater clarity, here are the two equations together.
$$\frac{dm_{g}}{dt}+\frac{dm_{f}}{dt}=-\dot{m}_{out}$$
$$c_g T_g \frac{dm_{g}}{dt}+c_l T_l \frac{dm_{l}}{dt}=\dot{Q}-\dot{m}_{out}h_{out}$$
PS:
I'm aware my approach seems different from what you've been doing in the thread. Maybe what I'm doing is oversimplified and won't capture the actual behavior you're observing experimentally. Still, since you're getting some strange artifacts from your current approach to the problem, it might still be worth trying this method and comparing the results. I assume the differential equations should produce a non-stopping decline in mass within the tank as long as there is a mass output. Pressure and temperature will remain constant until there is no more liquid and then you switch to ideal gas or something similar because your experimental data is enough to determine the mass without having to solve a differential equation.
By the way, are you sure you have a saturated mixture in the tank? I think you haven't shared what's the chemical inside in detail so I couldn't check with some tables (if there are any for that compound).
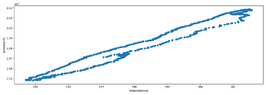
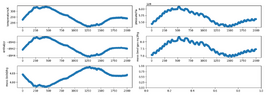
From your data, I'm not sure if it's OK to assume the properties remain constant during the phase change although it's impossible to judge without knowing how are the discharges (how much it opens, for how long, etc.). In the red arrows, I'd expect to see a more constant behavior because the amount of liquid there should be greatest. However, I only see a constant behavior in the blue arrows. Since the temperature keeps dropping slightly, I assume it's discharging but the pressure is not changing. In theory, temperature should not change either within the chamber but you're not measuring at that point but in the room. Also, as previously mentioned, if the process is too violent the tank's content won't have time to equalize. Still, maybe there is liquid and the process is not as violent at the blue arrows so that phase change can be more easily observed.

The condensed amount might be very small. Have you tried ignoring it and comparing the results to your experimental data? It might give you a good enough approximation.