Leopold89 said:
Oh, no. I plotted the gauge pressures. The absolute pressures are only in post #71.
:(
That could change the problem significantly. I did everything assuming we're talking about absolute pressures.
Leopold89 said:
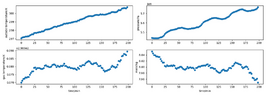
I calculate precisely this in post #88. It is the bottom right graph.
If that's true, then all I can think of is two things:
- either the new data regarding absolute pressures changes the problem significantly because you're inside the bell although you mentioned you're checking if that's the case and it seems it's gas all the time
- or your sensors are not accurate.
My bet is that your temperature sensor is not accurate to describe the gas' temperature since it's not inside the tank. Could you at least attach it to an outside wall of the tank and cover it with an insulating paste of some kind?
However, it's also true that the jaggedness is introduced by the pressure sensor... I really don't know what's going on and I'm running out of ideas.
Maybe some sort of resonance between the springs in the valve and the compressed gas? I'd be very surprised it's not dissipated quickly and also the period is too long. I'm throwing ideas to the wall and seeing what sticks at this point.
By the way, I didn't know you already tried my approach on post #88 so I did it too although I'm using the values from #73 where I assumed we're talking about absolute pressures.
In theory, the problem should be doable just with Pyromat because you can get the specific volume from the pressure and temperature but I got a different result compared to what was done in #73. I guess I'm not experienced enough with that library and I'm committing a mistake. I calculated the mass again using the gascompressibility library to find ##Z## (after a few awful unit conversions) and then I did get the same results as in post #73.
So the red one is the one I trust for now. I can't find what I did wrong with Pyromat because I told it to use the SI units.
I won't be able to invest more time in this for a few days. And even if I did I feel I have nothing else to add. I'll keep my eyes open in case the mysteries are solved somehow. Again, I think you'd get some actual temperature readings from inside the tank if you want to proceed with this method. If the manufacturer insists on it not being possible then you'll have to fight him or find an alternative method. Maybe even checking your pressure sensors to see if they're working correctly.
Here is the associated code and text file containing the pressure and temperature history.
NOTE: I once tried to copy code from the Forum to Spyder and it didn't work very well. If you have that issue, try pasting it on ChatGPT and it'll give you the code back in a format you can easily paste on Spyder.
[CODE lang="python" title="MassCalculation"]import pandas as pd
import numpy as np
import matplotlib.pyplot as plt
import pyromat as pm
import gascompressibility as gc
pm.config['unit_pressure']='Pa'
pm.config['unit_temperature']='K'
pm.config['unit_mass']='kg'
pm.config['unit_volume']='m3'
co2 = pm.get('ig.CO2')
V = 0.05 # Tank's volume [m3]
# Specify the path to the file
# Pressure and temperature at a given time step by the sensors
file_path_1 = 'D:\Datos de Usuario\Descargas\SmallDataSet_Juanda.txt'
dataPTt = pd.read_csv(file_path_1, sep=';')
Time_sensor_array = dataPTt['Time [date, hour]'].to_numpy() #[date, hour]
Temperature_sensor_array = dataPTt['Temperature [K]'].to_numpy() #[K]
Pressure_sensor_array = dataPTt['Pressure [Pa]'].to_numpy() #[Pa]
def create_incrementing_array(input_array):
# Measure the size of the input array
size = len(input_array)
# Create a new array starting from 0 and incrementing by 2 until it's the same size as the input array
new_array = [i * 2 for i in range(size)]
return new_array
Time_sensor_array_2min = create_incrementing_array(Time_sensor_array)
# Using pyromat to find the specific volume [m3/kg]. It gives of a different result than in post #73 using compressibility (I thought it was absolute pressures)
Specific_volume_pyromat = co2.v(T=Temperature_sensor_array, p=Pressure_sensor_array) #[m3/kg]
# print(Specific_volume_pyromat[0])
m_pyromat = V/Specific_volume_pyromat
P_cr_CO2 = 7.39*10**6 # Critical pressure (top of the bell) [Pa]
T_cr_CO2 = 304.2 # Critical temperature (top of the bell) [K]
R = 188.9 # Gas constant [J/kgK]
P_R_CO2 = Pressure_sensor_array/P_cr_CO2
T_R_CO2 = Temperature_sensor_array/T_cr_CO2
Pressure_sensor_array_PSGI = (Pressure_sensor_array-(0.1*10**6))/6895
Temperature_sensor_array_F = (Temperature_sensor_array - 273.15) * 9 / 5 + 32
Z_0 = gc.calc_z(sg=1, P=Pressure_sensor_array_PSGI[0], T=Temperature_sensor_array_F[0], H2S=None, CO2=1, N2=None, Pr=P_R_CO2[0], Tr=T_R_CO2[0], pmodel='piper')
# print(Z_0)
def compute_compressibility_factors(pressure_array, temperature_array, Pr_array, Tr_array):
"""
Compute the compressibility factor Z for each coordinate in the input vectors.
Parameters:
- pressure_array: Array of pressure values in PSGI.
- temperature_array: Array of temperature values in Fahrenheit.
- Pr_array: Array of reduced pressures for each coordinate.
- Tr_array: Array of reduced temperatures for each coordinate.
Returns:
- A NumPy array of compressibility factors Z.
"""
# Compute Z for each coordinate and collect the results in a list
Z_list = [gc.calc_z(
sg=1,
P=pressure_array
,
T=temperature_array,
H2S=None,
CO2=1,
N2=None,
Pr=Pr_array,
Tr=Tr_array,
pmodel='piper'
) for i in range(len(pressure_array))]
# Convert the list of Z values to a NumPy array
return np.array(Z_list)
Z_values = compute_compressibility_factors(
Pressure_sensor_array_PSGI,
Temperature_sensor_array_F,
P_R_CO2,
T_R_CO2
)
# print(Z_values[0])
# Using compressibility (import gascompressibility as gc) to find the specific volume [m3/kg]. I get the same as in #73 (assuming absolute pressures)
Specific_volume_compressibility = (Z_values*R*Temperature_sensor_array)/Pressure_sensor_array #[m3/kg]
m_gascompressibility = V/Specific_volume_compressibility
# print(m_gascompressibility[0])
# Ensure Time_sensor_array_2min has the same length as m_pyromat and m_gascompressibility
# If Time_sensor_array_2min does not match the lengths of m_pyromat and m_gascompressibility, adjust accordingly.
# Create the plot
plt.figure(figsize=(12, 6))
# Plot m_pyromat
plt.plot(Time_sensor_array_2min, m_pyromat, label='m_pyromat', color='blue', marker='o')
# Plot m_gascompressibility
plt.plot(Time_sensor_array_2min, m_gascompressibility, label='m_gascompressibility', color='red', marker='x')
# Add labels and title
plt.xlabel('Time (min)')
plt.ylabel('Mass (kg)')
plt.title('Comparison of Mass Calculated with pyromat and gascompressibility')
plt.legend()
plt.grid(True)
# Display the plot
plt.show()[/CODE]