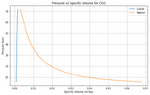
From this data, we have established that the mass is initially all in the gaseous state according to
this table of saturated ##\mathrm{CO_2}## because at 24ºC (297 K) you're below the saturation pressure.
View attachment 350427
I'm not yet ready to study the evolution of the system as you discharge the content of the tank but I think I can calculate the initial mass from the experimental data you have.
I'm using a different approach to the one you used there and got a different result too.
Using the ideal gas law being so close to the saturation bell doesn't give accurate results but there is an adapted formula for that.
View attachment 350428
View attachment 350429
View attachment 350430
The
critical-point of ##\mathrm{CO_2}## is ##P_{cr}=7.39 \ \mathrm{MPa}## and ##T_{cr}=304.2 \ \mathrm{K}##.
View attachment 350431
Therefore, from your data, the reduced pressure and reduced temperature are:
$$T_R = \frac{T}{T_cr}=\frac{297.1}{304.2}=0.98$$
$$P_R = \frac{P}{P_cr}=\frac{5.43}{7.39}=0.75$$
So your compressibility factor ##Z## should be around ##Z=0.64##.
View attachment 350432
From the definition of ##Z##, it is possible to obtain the specific volume of the gas.
(Using SI units whenever units don't cancel)
$$Z = \frac{Pv}{RT} \rightarrow v = \frac{ZRT}{P}=\frac{0.64*188.9*297.1}{5.43*10^6}=0.006615 \ \mathrm{m^3/kg}$$
Lastly, knowing the tank's volume is ##V = 0.05 \ \mathrm{m^3}## we can find the actual mass.
$$v=V/m \rightarrow m=V/v=\frac{0.05}{0.006615}=7.56 \ \mathrm{kg}$$
I'm not sure if it's my first or second time in my life doing these calculations but I followed the book "Thermodynamics An Engineering Approach" by the letter so I believe it'd be OK. Feel free to point out any errors or comments.