schniefen
- 177
- 4
- TL;DR
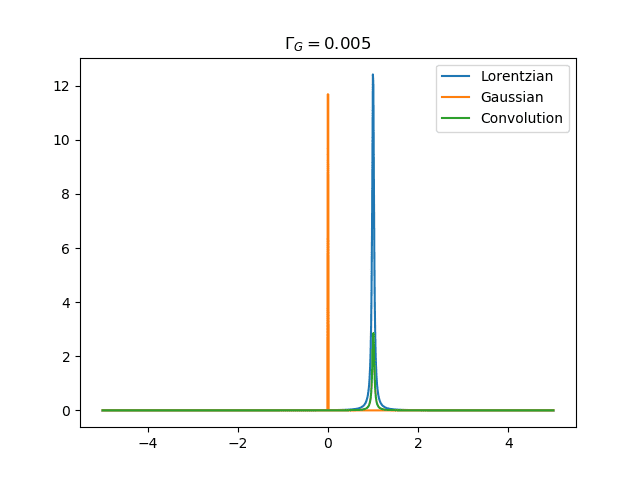
- The title sums it up and this is something I'd like to plot. I'd also like for the Gaussian to be centered at ##x=0## whereas the Lorentzian should be centered at ##x=1##.
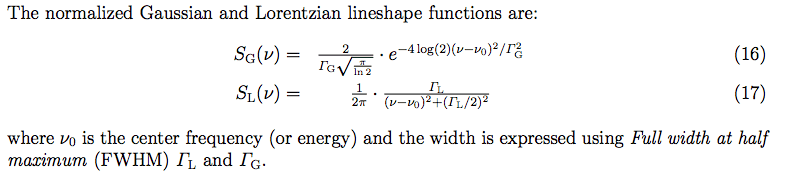
I'd like to plot the normalized convolution of a Gaussian with a Lorentzian (see the definitions in terms of full width half maximum (fwhm) in the attached image). Here is my attempt, but the print statements with np.trapz() do not return 1 in both cases, but rather ##\approx##0.2. I'd also like to change the fwhm and plot different convolutions. Is there a normalization factor missing when the parameter fwhm is changed?
Python:
import numpy as np
import matplotlib.pyplot as plt

#lorentzian
def loren(x,x0,fwhm):
    a=fwhm/(2*np.pi)
    y=a*1/((x-x0)**2+(fwhm/2)**2)
    return y
# gaussian
def gaussian(x, x0, fwhm):
    a = 2. / fwhm / np.sqrt(np.pi / np.log(2))
    y = a * np.exp(-4 * np.log(2) * (x-x0)**2 / fwhm**2)
    return y
# define x-axis
x = np.linspace(-5, 5, 1000)
dx = x[1] - x[0]
# the 'main distribution' centered at x0, 'broad distrbution' at x1
x0 = 1
x1=0
dist_main = loren(x, x0, 0.05)
dist_broad = gaussian(x, x1, 0.005)
# calculate the convolution, multiplication with dx is for normalization
dist_conv = np.convolve(dist_main, dist_broad * dx, mode='same')
# plotting
fig, ax = plt.subplots()
ax.plot(x, dist_main, label='Lorentzian')
ax.plot(x, dist_broad, label='Gaussian')
ax.plot(x, dist_conv, label='Convolution')
ax.set_title('$\Gamma_G=0.005$')
ax.legend()
plt.show()

print(np.trapz(dist_broad,x,dx))
print(np.trapz(dist_conv,x,dx))
Last edited: